Rapid Fire Abstracts
Rawan Abuzinadah, MSc
PhD student
University of Leeds, Leeds Institute of Cardiovascular and Metabolic Medicine (LICAMM), United Kingdom

Sven Plein, MD, PhD
Professor of Cardiology
Leeds Institute of Cardiovascular and Metabolic Medicine, United Kingdom
David A. Broadbent, PhD
Principal Clinical Scientist (MRI Physics)
Leeds Institute of Cardiovascular and Metabolic Medicine, United Kingdom
Lizette Cash, MRT
Operational Radiographer (Cross-Sectional)
Department of Biomedical Imaging Science, Leeds, United Kingdom & Advanced Imaging Centre, Leeds Teaching Hospitals NHS Trust, United Kingdom, United Kingdom
David Shelley, MSc
Radiographer
Leeds teaching hospital trusts, United Kingdom

Malenka M. Bissell, MD, PhD
Clinical lecturer
University of Leeds, United Kingdom
Diagnosis of coarctation of the aorta (CoA) remains difficult even postnatally while the ductus arteriosus remains patent.
This study aims to evaluate the cardiovascular magnetic resonance (CMR) based left ventricular (LV) global longitudinal strain (LV-PGLS) in new-borns with antenatal suspicion of coarctation of the aorta (CoA).
Methods:
A neonatal non-sedated feed and wrap CMR was performed on a 3T MRI scanner in 30 neonates with an antenatal suspicion of CoA. Four chamber and LV two chamber TurboFLASH Cine sequences were used for LV-PGLS assessment. Analysis was performed using commercially available software (suite HEART-NEOSOFT). Patients were divided into three groups; group 1: patients who postnatally did not have CoA; group 2: patients who postnatally had a hypoplastic aortic arch only, and group 3: patients who had a duct dependent coarctation requiring neonatal surgery. Kruskal-Wallis test was used for comparison across groups. Bland-Altman plots were used to assess intra-observer variability. The ROC curve was analysed to assess the potential clinical utility of LV-PGLS in CoA diagnosis.
Results:
3/30 neonates were excluded (2/3 due to insufficient image quality of the LV; 1/3 due to additional complex CHD). From the remaining 27 neonates, 10 patients were in group 1, 8 patients in group 2, and 9 patients in group 3. (Median age at MRI scan was 3.00 days, IQR [1-6 days]); 55.6% Females (N=15) vs 44.4% Males (N=12). Patients in group 3 with confirmed CoA had significantly lower LV-PGLS (Median= -17.5%; IQR [-18.3, -16.5]) compared to group 1 (Median=-22.2%, IQR [-24.3, -22.0]), and group 2 (Median= -20.7%, IQR [-22.3, -18.4]), p < 0.01. Pairwise comparison between the groups revealed this difference to be between group 1 and 3 (p< 0.01), and between group 1 and 2 (p< 0.05). The AUC of LV-PGLS was 0.926, 95% CI (0.82-1.03).
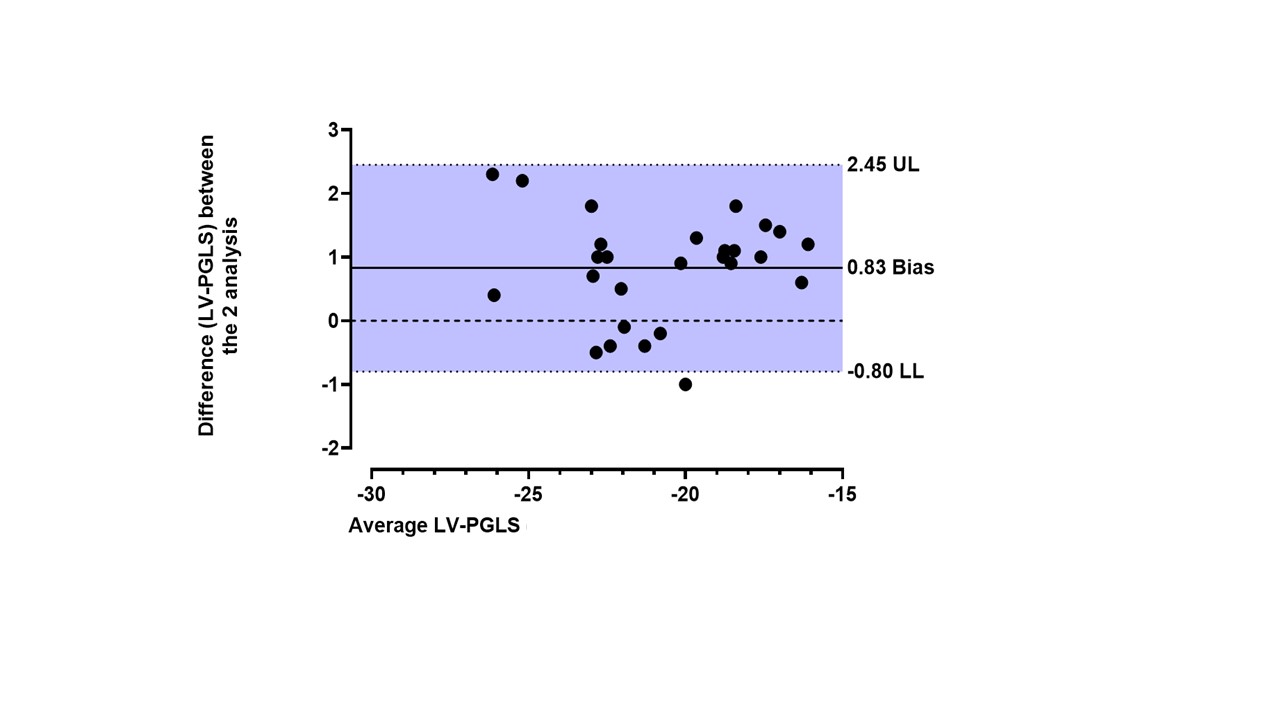
Bland-Altman analysis showed a Bias of 0.83 and 95% limits of agreement -0.80 to 2.45 between the LV-PGLS values obtained during intra-observer variability assessment.
Conclusion:
LV-PGLS is feasible using neonatal feed and wrap CMR. Patients with confirmed CoA have a lower LV-PGLS compared to patients with a hypoplastic aortic arch or normal aortic arch. This suggests LV-PGLS might be a useful parameter in assessing myocardial function in patients with antenatal suspicion of CoA. The AUC demonstrates that LV-PGLS has the ability to discriminate between patients with CoA and patients who have a normal aortic arch in the neonatal period.
Figure (1): Illustrates the strain analysis from the 4 chamber view (A)and LV 2 chamber view (B); by segmenting the endocardium and epicardium, then delineating the mitral valve annulus and the apex to obtain the global strain value. Graph (C) illustrates the LV-PGLS of the myocardium. 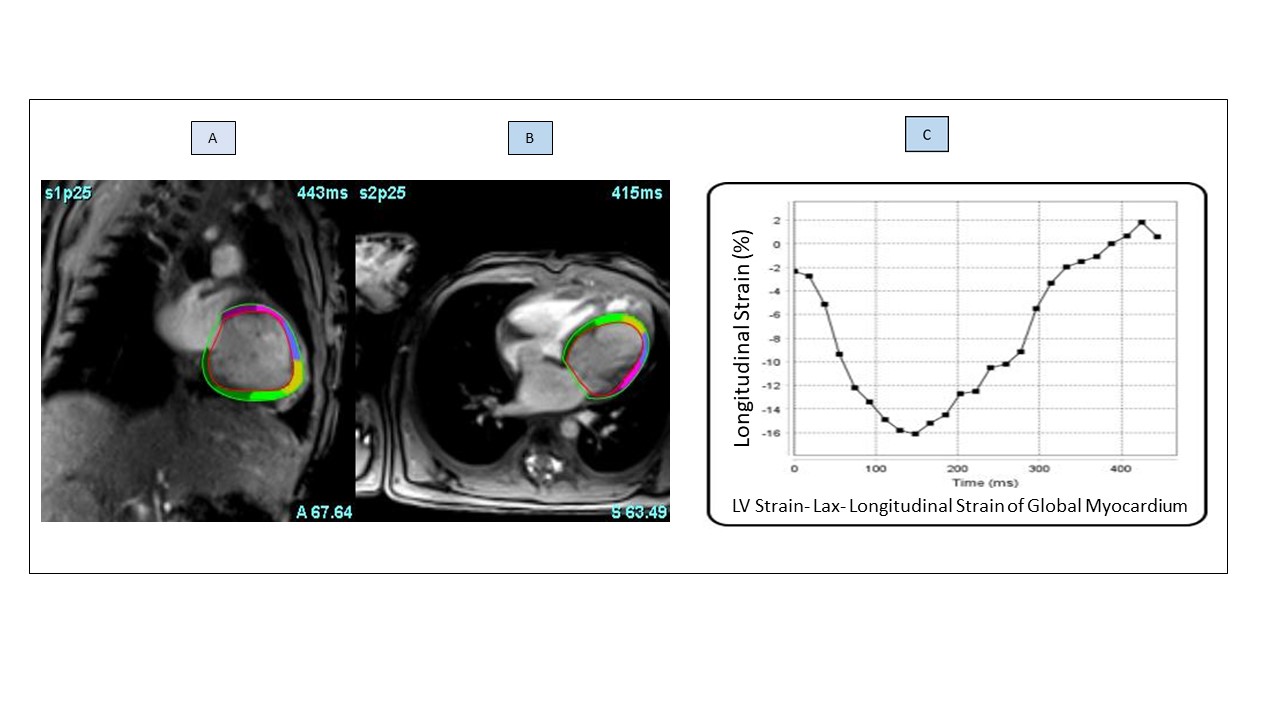
Figure 2: (A) Box plots show the differences in left ventricular peak global longitudinal strain (LV-PGLS) values between the patient groups. Group 1 (non-CoA): patients who postnatally did not have CoA; Group 2 (hypoplastic arch): were patients who postnatally had a hypoplastic aortic arch only, and group 3 (CoA): patients who had a duct dependent coarctation requiring neonatal surgery . M; Median, IQR; interquartile range, LAX; long axis, LV; left ventricle, CoA; Coarctation of the aorta (B) ROC curve of the LV-PGLS value. AUC= 0.926 (95%CI= 0.818 – 1.033). LV-PGLS; left ventricle peak global longitudinal strain. 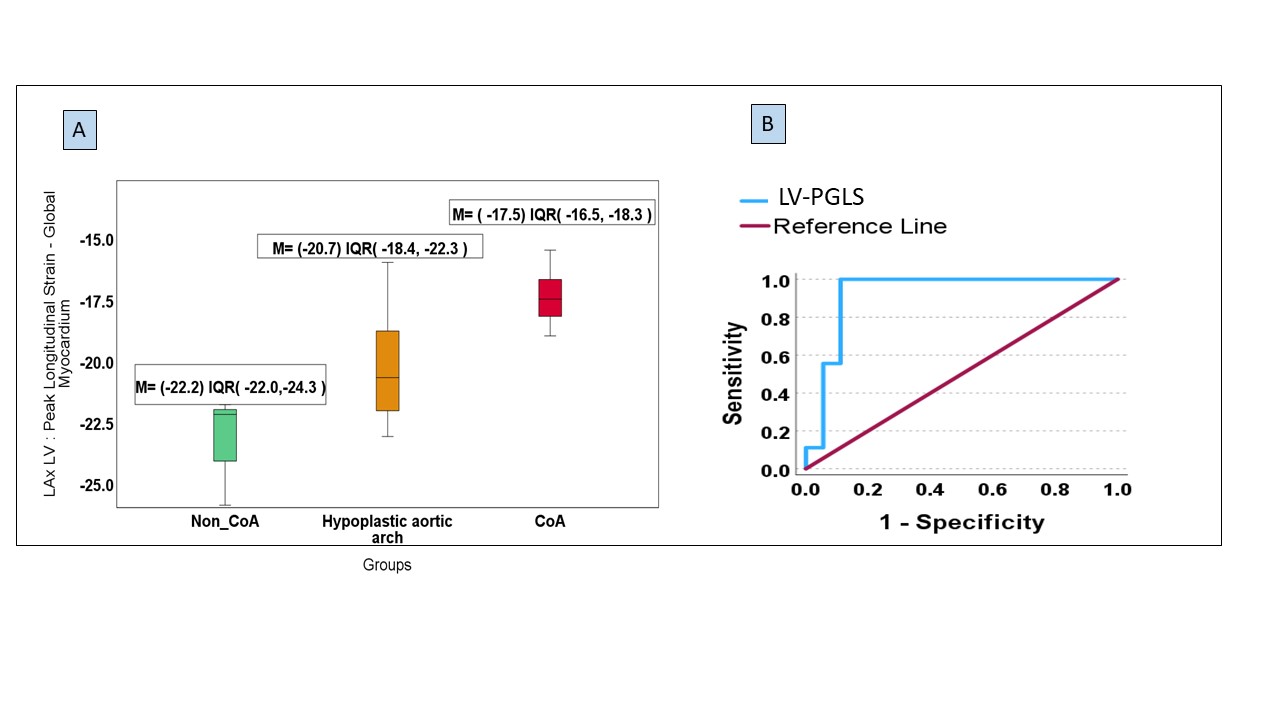
Figure (3): Bland-Altman plot to evaluate the bias between the 2 repeated measurements of LV-PGLS (intra-observer variability) The solid line depicts the mean difference (bias) and the dashed lines shows ±1.96 standard deviations of difference; UL; upper limit, LL; lower limit.