Oral Abstract
Zhuoan Li, MSc
PhD Candidate
Laboratory for Translational Imaging for Microcirculation, Weldon School of Biomedical Engineering, Purdue University
Zhuoan Li, MSc
PhD Candidate
Laboratory for Translational Imaging for Microcirculation, Weldon School of Biomedical Engineering, Purdue University
Khalid Youssef, PhD
Assistant Research Professor
Indiana University, Department of Radiology and Imaging Sciences
Mehdi Amian, MSc
PhD Candidate
Purdue University
Dilek M. Yalcinkaya, MSc
PhD Candidate
Purdue University
Venkateshwar Polsani, MD
Director of CardioVascular MRI and CTA
Piedmont Heart Institute
Michael D. Elliott, MD
Director of Cardiac MRI
Atrium Health

Rohan Dharmakumar, PhD
Executive Director
Indiana University School of Medicine

ROBERT M. JUDD, PhD
Professor Emeritus
Duke University
Duke University
Dipan Shah, MD
Associate Professor
Houston Methodist DeBakey Heart & Vascular Center

Orlando P. Simonetti, PhD
Professor
The Ohio State University
Matthew S. Tong, DO
Associate Professor - Clinical
The Ohio State University

Behzad Sharif, PhD
Associate Professor of Biomedical Engineering
Purdue University
Extracellular volume fraction (ECV) is a validated CMR-derived marker of diffuse myocardial pathology and fibrosis. The typical requirement of blood draw within 24 hours of the CMR exam for measuring hematocrit (HCT) is a limiting factor for wider use of ECV in clinical routine.1 This has been the motivation for several single-center and two-center studies to evaluate the feasibility of predicting HCT from native bloodpool T1 using linear regression (LR) or model-based approaches.1-4 Here, we leverage the recently established SCMR Registry5 to: (1) evaluate the feasibility of deriving HCT from CMR measurements (to generate accurate synthetic ECV) in a multi-center setting; (2) evaluate the potential advantages of deep learning (DL) for predicting HCT with inclusion of additional features based on a data-driven machine learning approach.
Methods: As described in Table 1, five centers from the SCMR registry contributed data with one center (The Ohio State University) providing »70% of the data and acting as the internal dataset. The internal dataset is used for training the HCT-prediction model (LR model or DL model), while the external dataset (4 centers) is used solely for testing. All CMR scans in this study were performed under 1.5T. Fig 1 describes the methodology where 473 studies from the internal dataset are used for training and the remaining subset of 85 patients from the internal dataset are combined with 174 external studies to form the test dataset (size: 259 studies from 5 centers). The predictor “feature pool” included nine clinical variables and CMR measurements (listed in Table 1). As illustrated in Fig 1, a predictor importance ranking is conducted for these variables using the “tournament ranking” method6, and the optimal combination of predictors is selected to serve as input for the multi-stage training (MST) DL model. The MST model processes the selected predictors through multiple fully connected neural networks across four stages,6 with the final HCT prediction generated by aggregating outputs from the final stage. Agreement between the predicted HCT vs. true HCT were evaluated using Pearson correlation and Bland-Altman analysis and compared between LR and DL models.
Results:
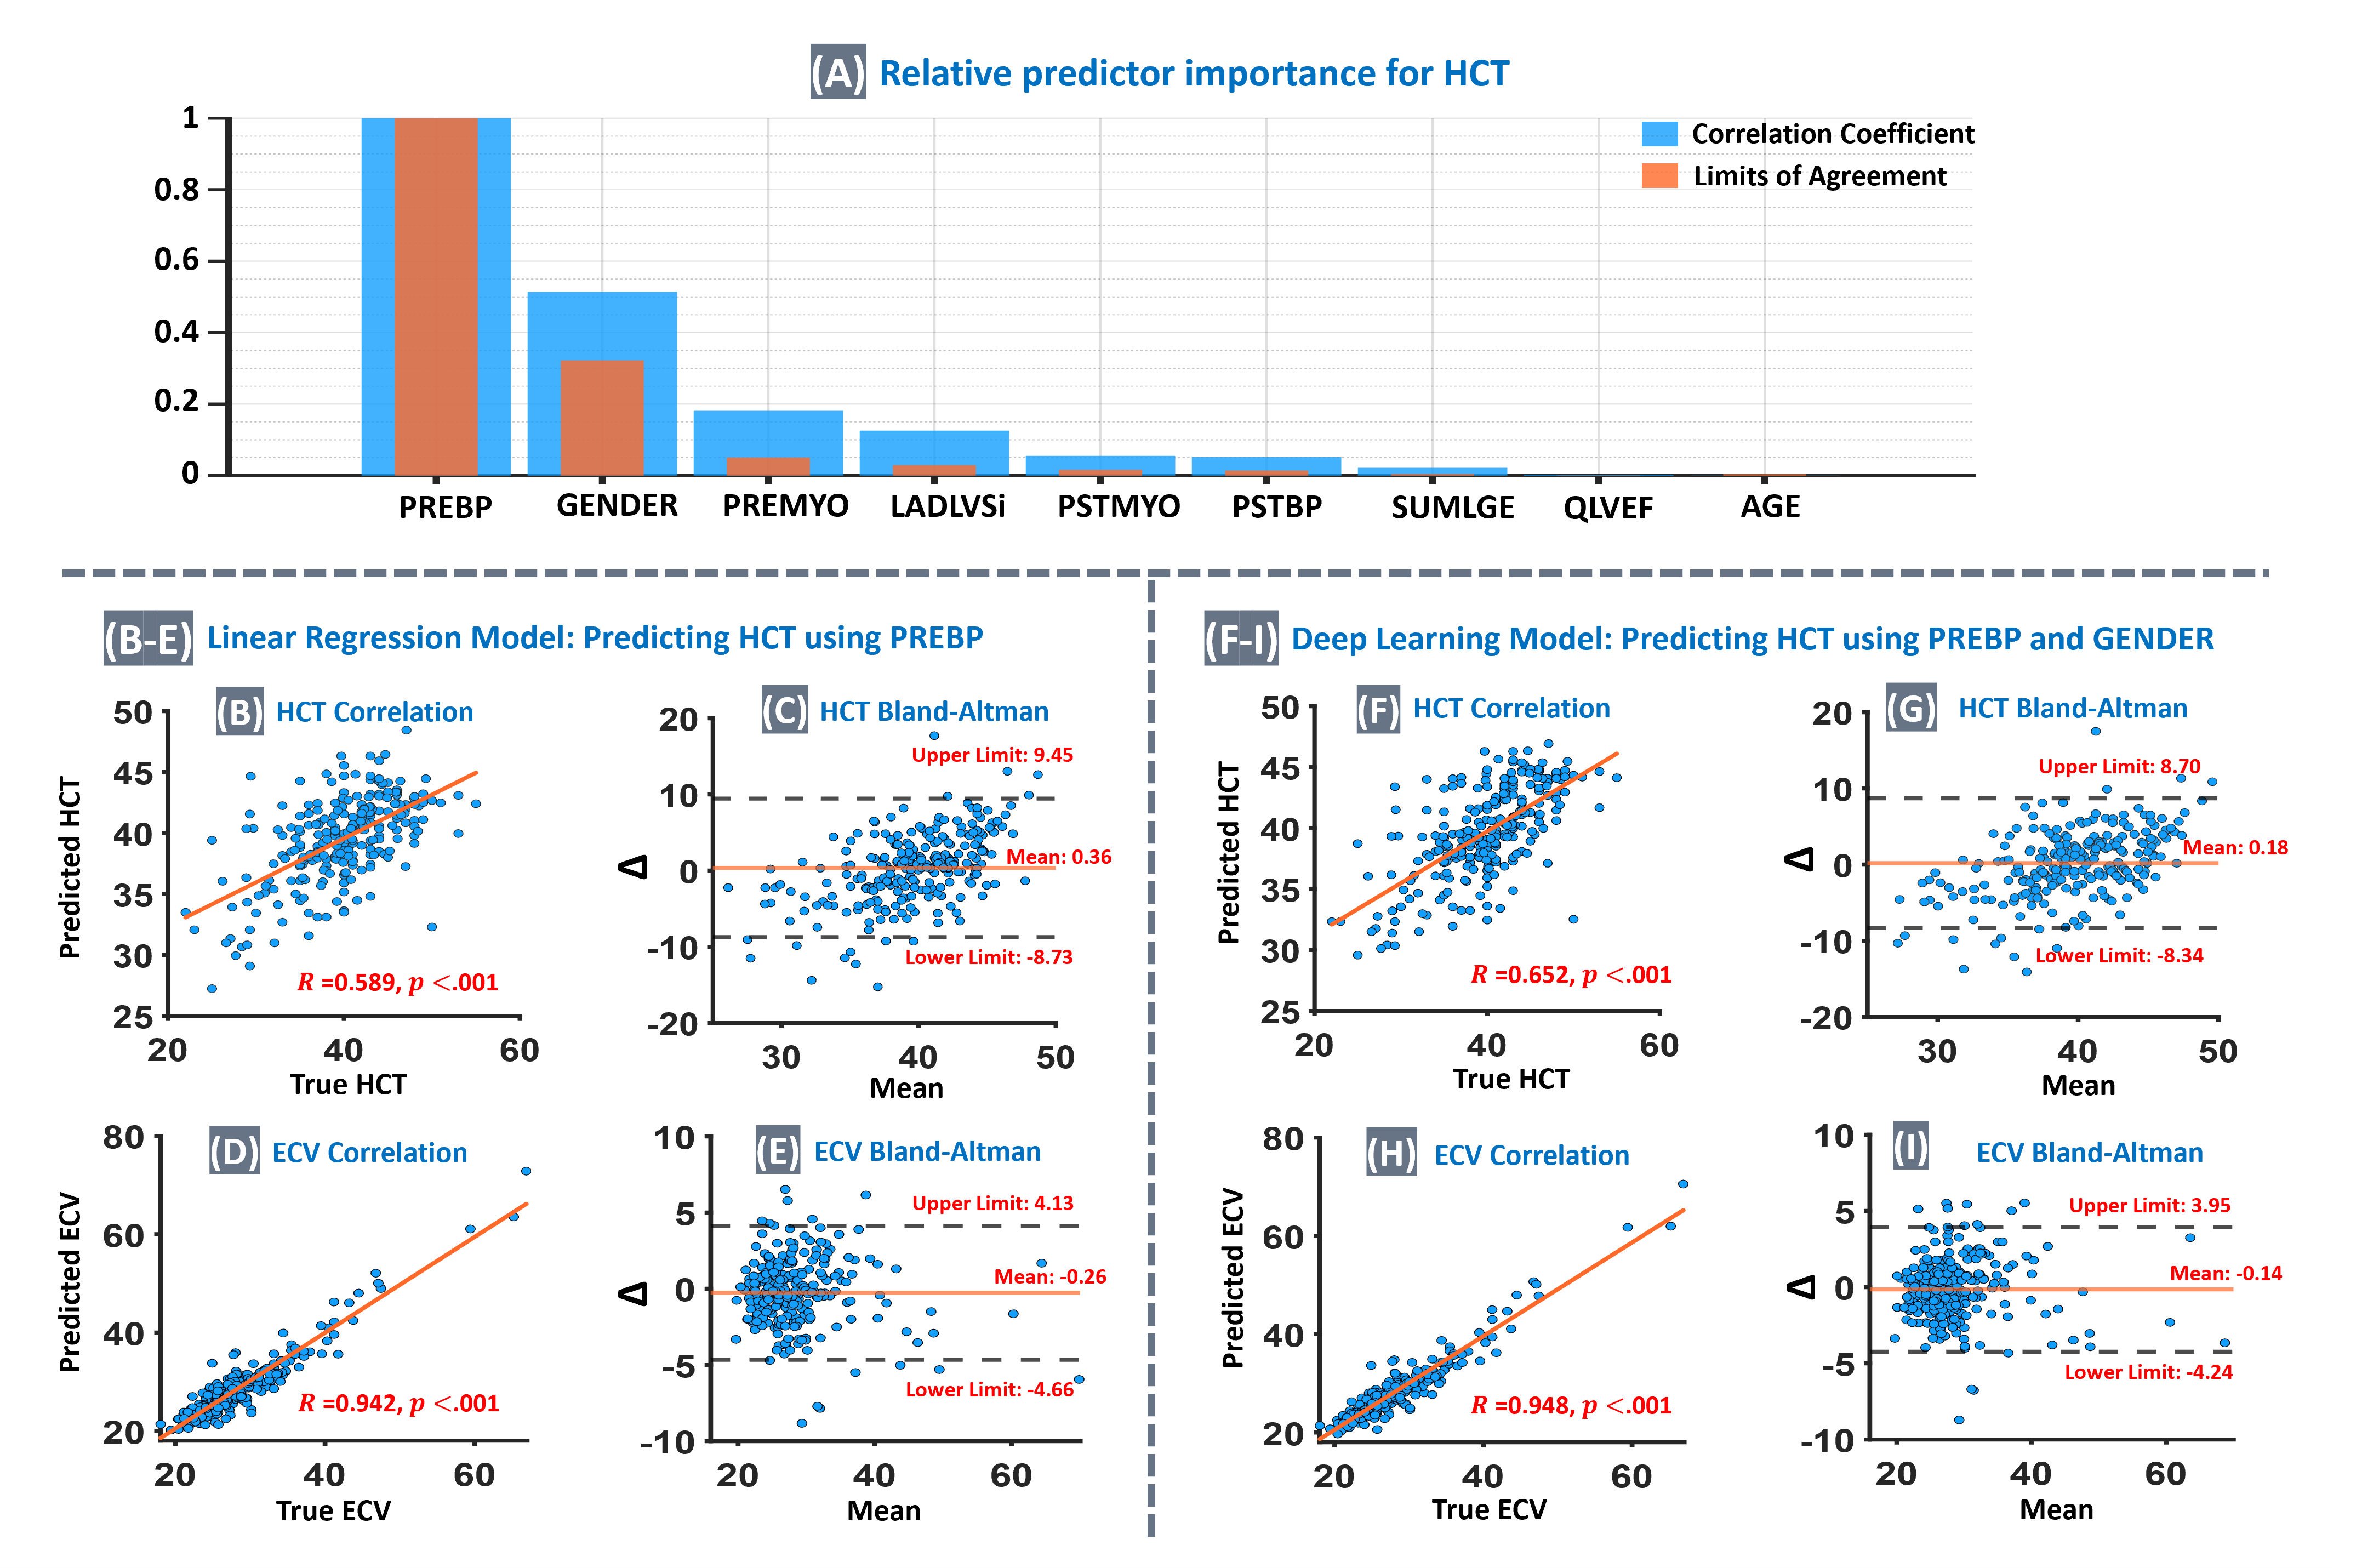
Fig. 2A shows the relative importance of individual features for HCT prediction, as determined by the known “tournament ranking” method,6 which identified the combination of native bloodpool T1 (PREBP) and gender as the optimal feature pair to use in the DL model for accurate Hematocrit prediction. Furthermore, the correlation analysis showed that the strength of correlation for DL-predicted HCT vs true HCT is significantly higher than the LR-predicted HCT (R=0.652 vs R=0.589, p < 0.001). The agreement level between synthetic ECV (DL model) and true ECV is similar to the previous single-center studies.2-4
Conclusion:
Enabled by the SCMR Registry5, our results show the feasibility of deriving HCT from CMR measurements without blood sampling (to generate synthetic ECV) in a multi-center setting (5 centers) which is larger than prior work1-4 (limited to 1 or 2 centers) with strong agreement between the resulting synthetic ECV vs. true ECV (R=0.95). Moreover, this is the first work that employs deep learning for this goal and our preliminary results suggest that using multiple features may improve the accuracy of synthetic hematocrit without blood sampling.
Description of the proposed deep learning methodology for improving the prediction of hematocrit from CMR-derived parameters in a multi-center setting. The proposed Hematocrit prediction approach uses datasets from the SCMR Registry, collected from 5 different centers. The internal dataset, consisting of 558 patients from one center, is used for training the model, while the external dataset, consisting of 174 patients from four other centers, is used solely for testing. A subset of 85 patients from the internal dataset is combined with all 174 external cases to form a test set of 259 multi-center patients, while the remaining 473 internal cases are used for training. The predictor “feature pool” includes nine variables (Table 1). A predictor importance ranking is conducted for these variables using the “tournament ranking” method6, and the optimal combination of predictors is selected to serve as input for the multi-stage training (MST) deep learning model.6 The MST model processes the selected predictors through multiple fully connected neural networks across four stages, with the final HCT prediction generated by aggregating outputs from the final stage.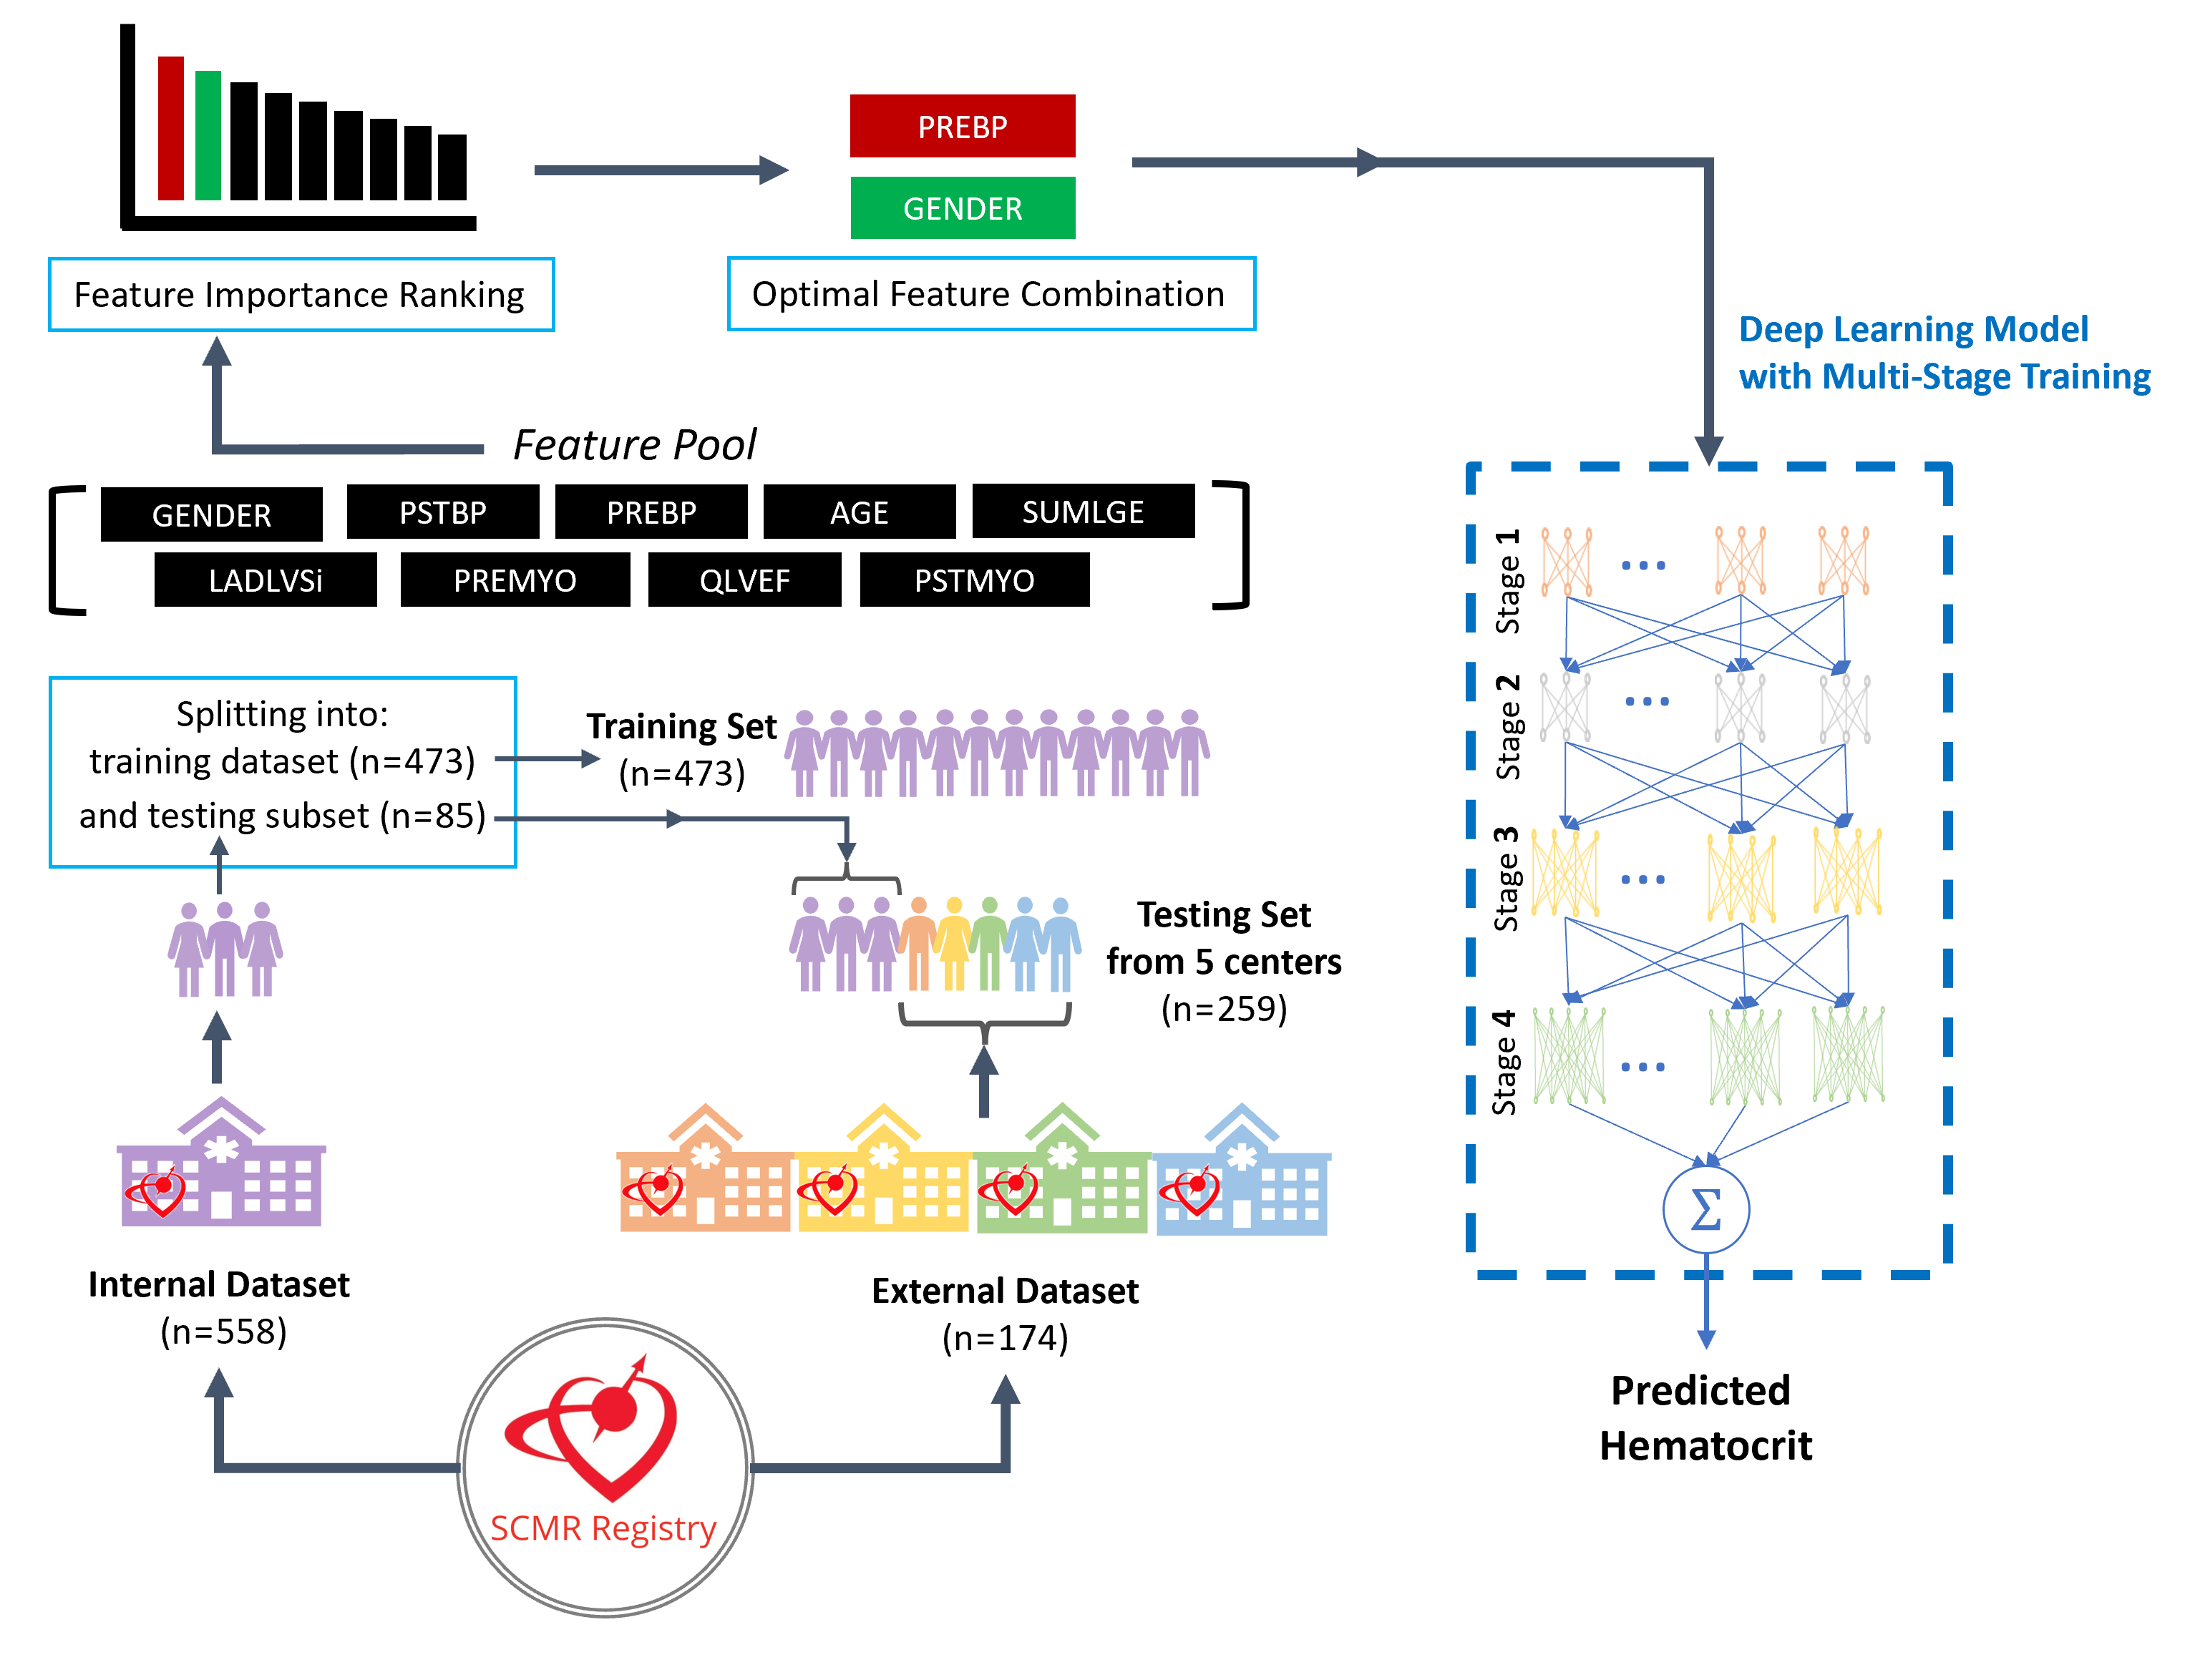
(A): Relative importance of individual features for hematocrit (HCT) prediction, as determined by the established “tournament ranking” method6. Importance values are normalized to the top predictor for clear comparison. The analysis evaluates predictor contributions based on both the correlation coefficient and the limits of agreement. Among the nine predictors considered (feature pool), the combination of native bloodpool T1 (PREBP) and Gender was identified as yielding the optimal model for accurate Hematocrit prediction. (B–E): Results for the LR model, using PREBP to predict HCT. (B): Correlation between true HCT and predicted HCT (R=0.589; 95% confidence interval: 0.482 to 0.681) was significant (p < 0.001). (C): Bland-Altman analysis for HCT, ∆ means difference between true and predicted values here. (D): Correlation between true vs synthetic ECV, calculated using the predicted HCT from the LR model (R=0.942, p<0.001). (E) Bland-Altman analysis for ECV. (F – I): Results of the optimized DL model using both PREBP and gender to predict HCT. (F): Correlation between true HCT vs predicted HCT (R=0.652; 95% confidence interval: 0.553 to 0.733) was significant (p < 0.001) and was significantly stronger than the LR model (test of difference: p<0.001). (G): Bland-Altman analysis for HCT, showed improvement vs. the LR model. (H): Correlation between true vs synthetic ECV using DL-predicted HCT (R=0.948, p<0.001). (I): Bland-Altman analysis for ECV, showed an improvement vs. the LR model.