Clinical & Translation

Alexander Schulz, MD
Dr.
Harvard Medical School / BIDMC, Germany
Alexander Schulz, MD
Dr.
Harvard Medical School / BIDMC, Germany
Judith Gronwald, MD
Cardiology resident
Department of Cardiology and Pneumology, University Medical Center Göttingen, Germany
Clara Hagedorn, MD
Research Fellow
Department of Cardiology and Pneumology, University Medical Center Göttingen, Germany
Torben Lange, MD
Resident
University Medical Center Göttingen, Germany, Germany

Thomas Stiermaier, MD
Cardiologist
University Heart Center Lübeck, Germany
Ruben Evertz, MD
Dr.
University Medical Center Göttingen, Germany, Germany
Sören Backhaus, MD
Consultant Cardiologist
Department of Cardiology, Heart Centre, Kerckhoff-Clinic Bad Nauheim, Germany
Johannes Kowallick, MD
Prof.
University Medical Center Göttingen, Germany, Germany
Gerd Hasenfuß, MD
Prof
University Medical Center Göttingen, Germany, Germany
Holger Thiele, MD
Director
Heart Center Leipzig, Germany

Ingo Eitel, MD
Director
University Heart Center Lübeck, Germany

Andreas Schuster, MD, PhD
Cardiologist
University Medical Center Göttingen, Germany
Epicardial adipose tissue (EAT) was recently outlined as an important variable and risk factor in cardiovascular disease in general causing less-favourable myocardial remodelling over time. However, data on its impact on patients with acute myocardial infarction (AMI) is scarce. We hypothesised, that cardiovascular magnetic resonance (CMR)-derived EAT volumes allow for risk stratification even beyond conventional cardiovascular risk factors.
Methods:
A total of 1168 patients receiving percutaneous coronary intervention for treatment of AMI underwent CMR within 10 days after the index event. After exclusion of incomplete and non-analysable datasets, EAT volumes were quantified in 962 patients using CMR-derived short-axis stacks and indexed to body surface area (see Figure 1). Additional measures of left ventricular morphology and function, as well as scar size were obtained from CMR. The occurrence of major adverse cardiovascular events (MACE) after 12 months was defined as the primary clinical endpoint. The incidence of MACE in patients with different EAT volumes was compared as well as in patients with and without obesity as defined by the world health organization.
Results:
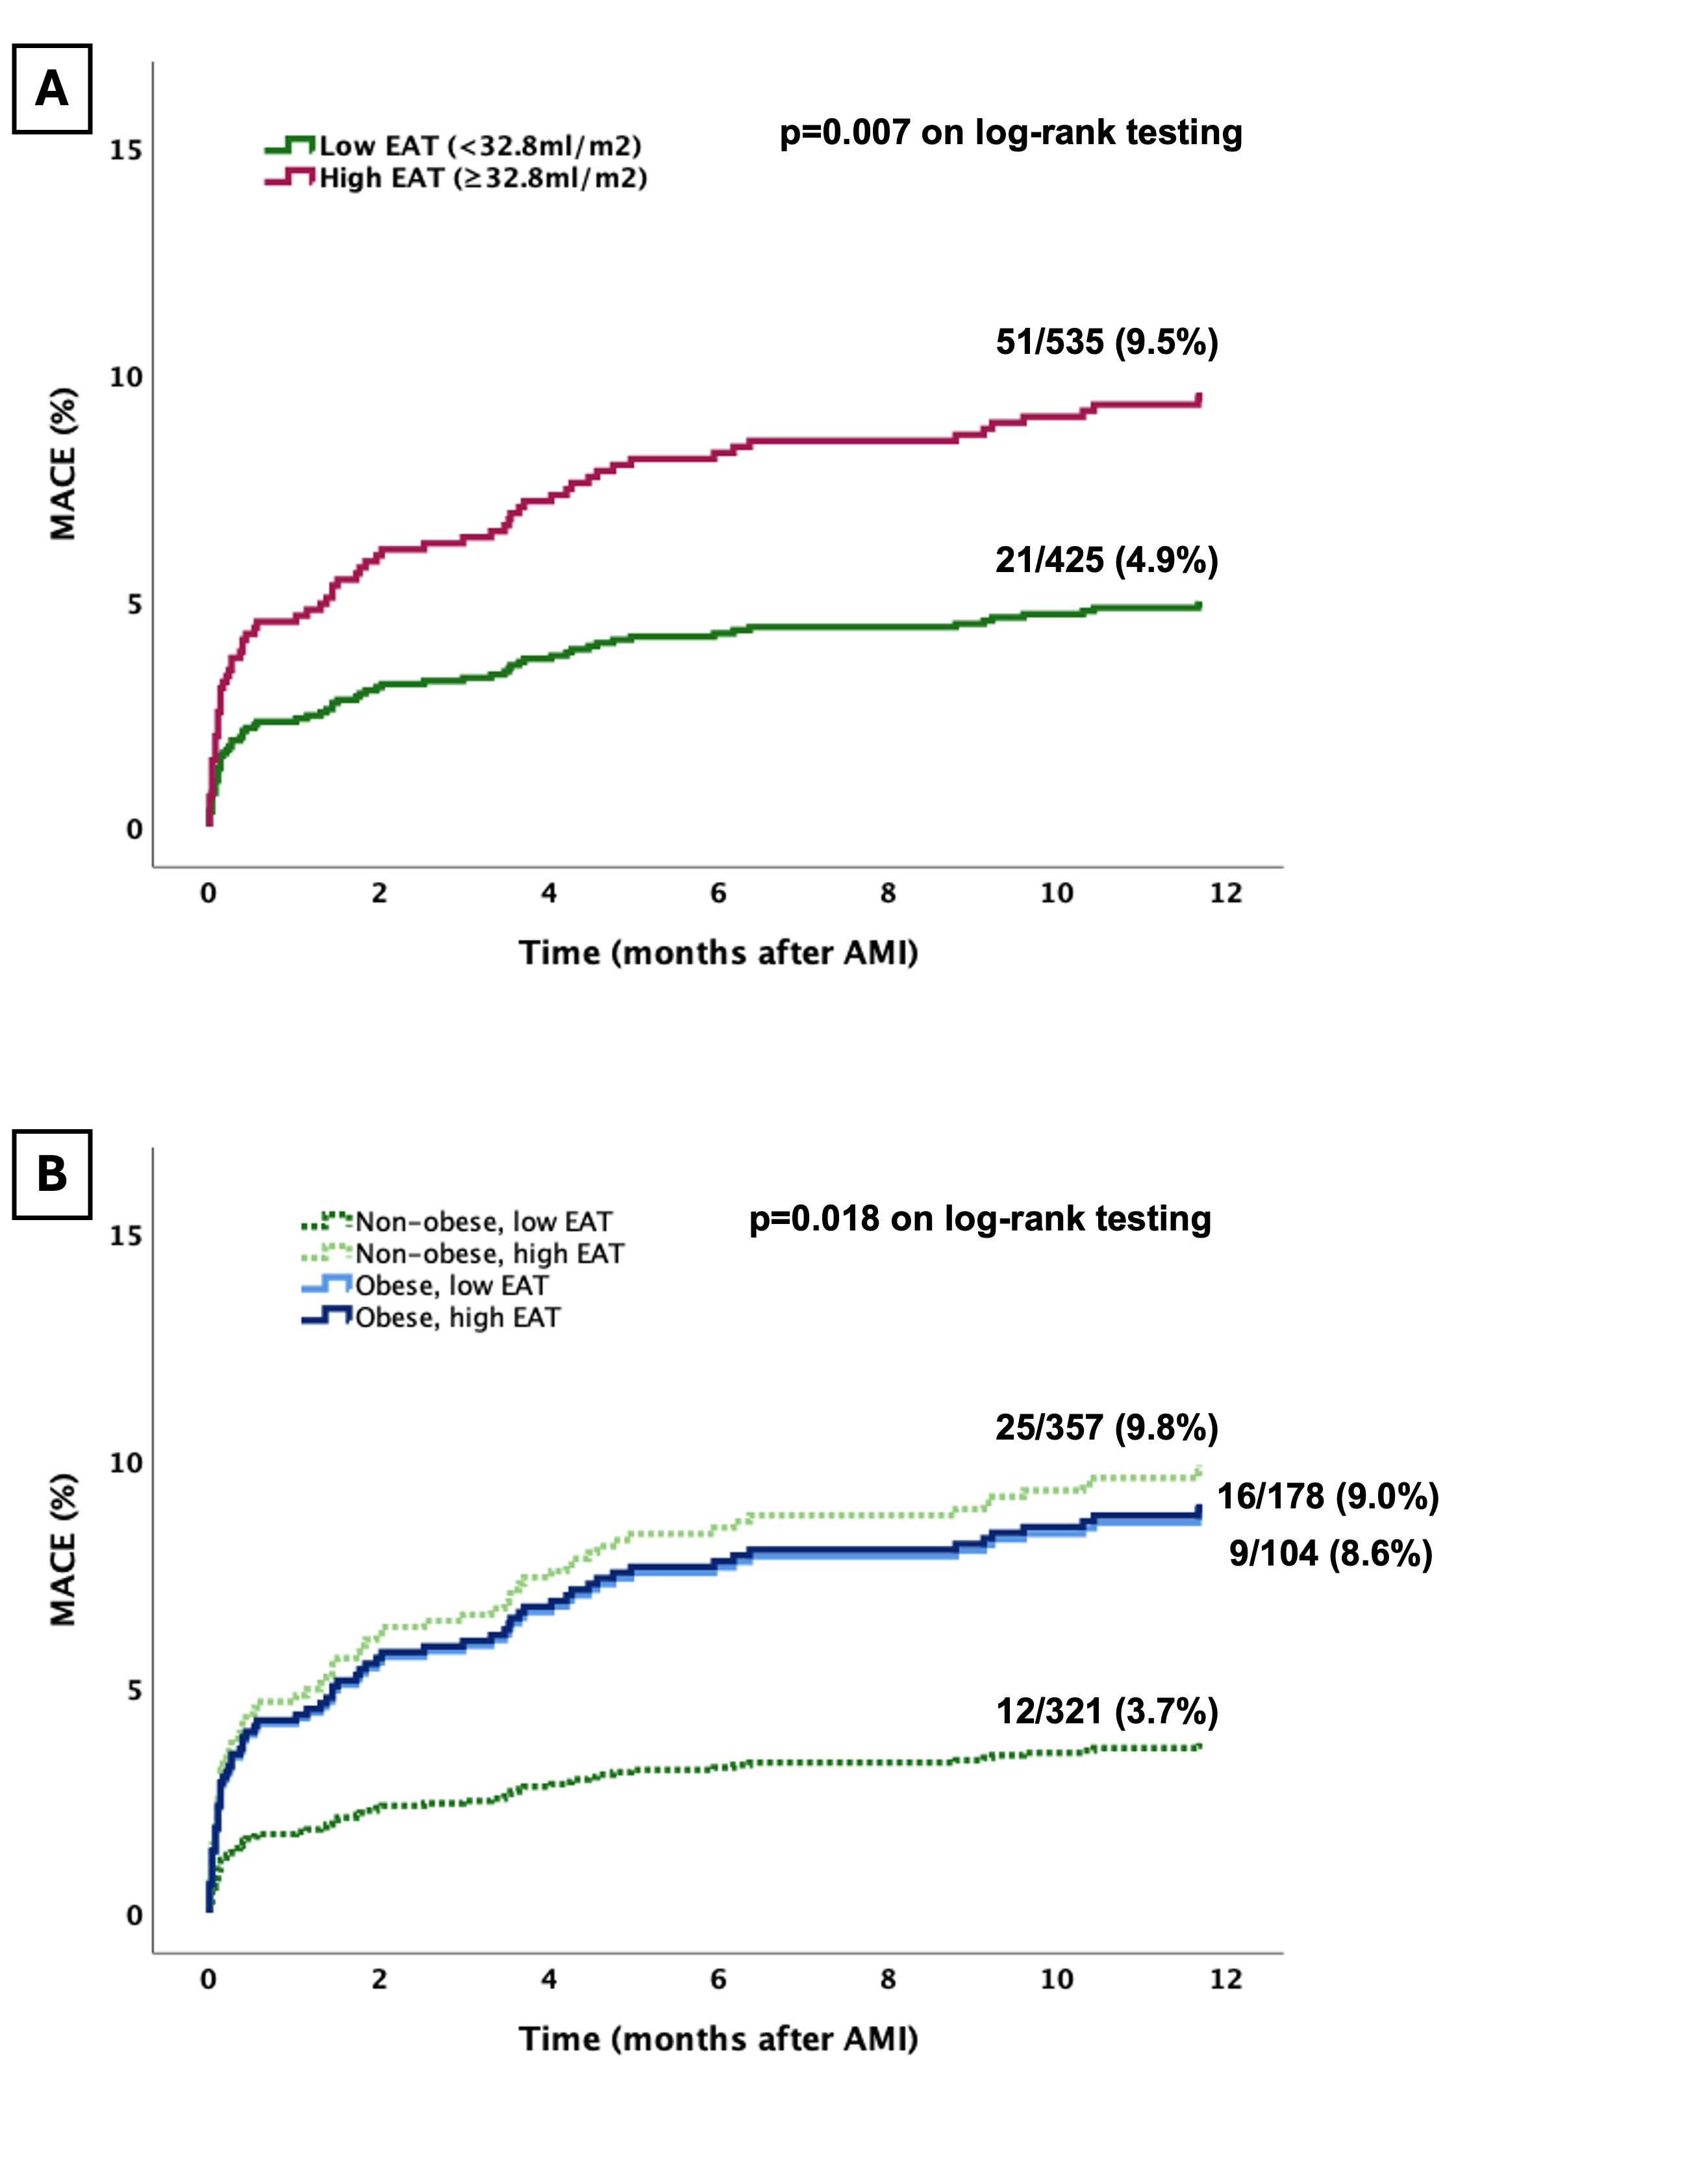
Using Youden’s-Index, a cut-off value of 32.8ml/m2 EAT volume was found to identify high-risk patients the best (p=0.007 on log-rank testing, see Figure 2A). The cohort was dichotomized into patients with high EAT volumes (≥32.8ml/m2 EAT, n=535) and low EAT volumes (< 32.8ml/m2, n=427) (See Figure 1). Patients with high EAT volumes were slightly older (63.7±12.1 vs. 62.0±12.8years, p=0.045), had slightly higher BMI (28.4±4.3kg/m2 vs. 27.6±4.3kg/m2, p=0.006) but had a comparable proportion of male patients (77% vs. 72%, p=0.092). Patients with high and low EAT volumes had similar scar size (LGE extend: 15.5±11.8% vs. 14.4±12.6%, p=0.165) and LV function (49.9±11.0% vs. 49.7±10.2%, p=0.825) after AMI. Details can be appreciated from Table 1. Increased EAT volumes were associated with MACE in univariable cox-regression analysis (HR 2.0 95% CI 1.2-3.3, p=0.009) and remained independently associated with MACE in a multivariable cox-regression analysis including patient characteristics, LV function and scar size (HR 1.8 95% CI 1.1-3.1, p=0.027) (Figure 2A). Furthermore, non-obese patients with increased EAT had similar risk for MACE compared to obese patients (see Figure 2B).
Conclusion:
Increased CMR-derived EAT is a predictor for MACE after AMI, independent of scar size, LV function and conventional cardiovascular risk factors. Furthermore, it indicates an increased risk of MACE in non-obese patients which is comparable to the risk of obese patients.
Figure 1: CMR-derived quantification of EAT using short-axis stacks and dichotomization of the cohort using Youden’s-Index with a cut-off value of 32.8ml/m2. CMR – cardiovascular magnetic resonance imaging, EAT – epicardial adipose tissue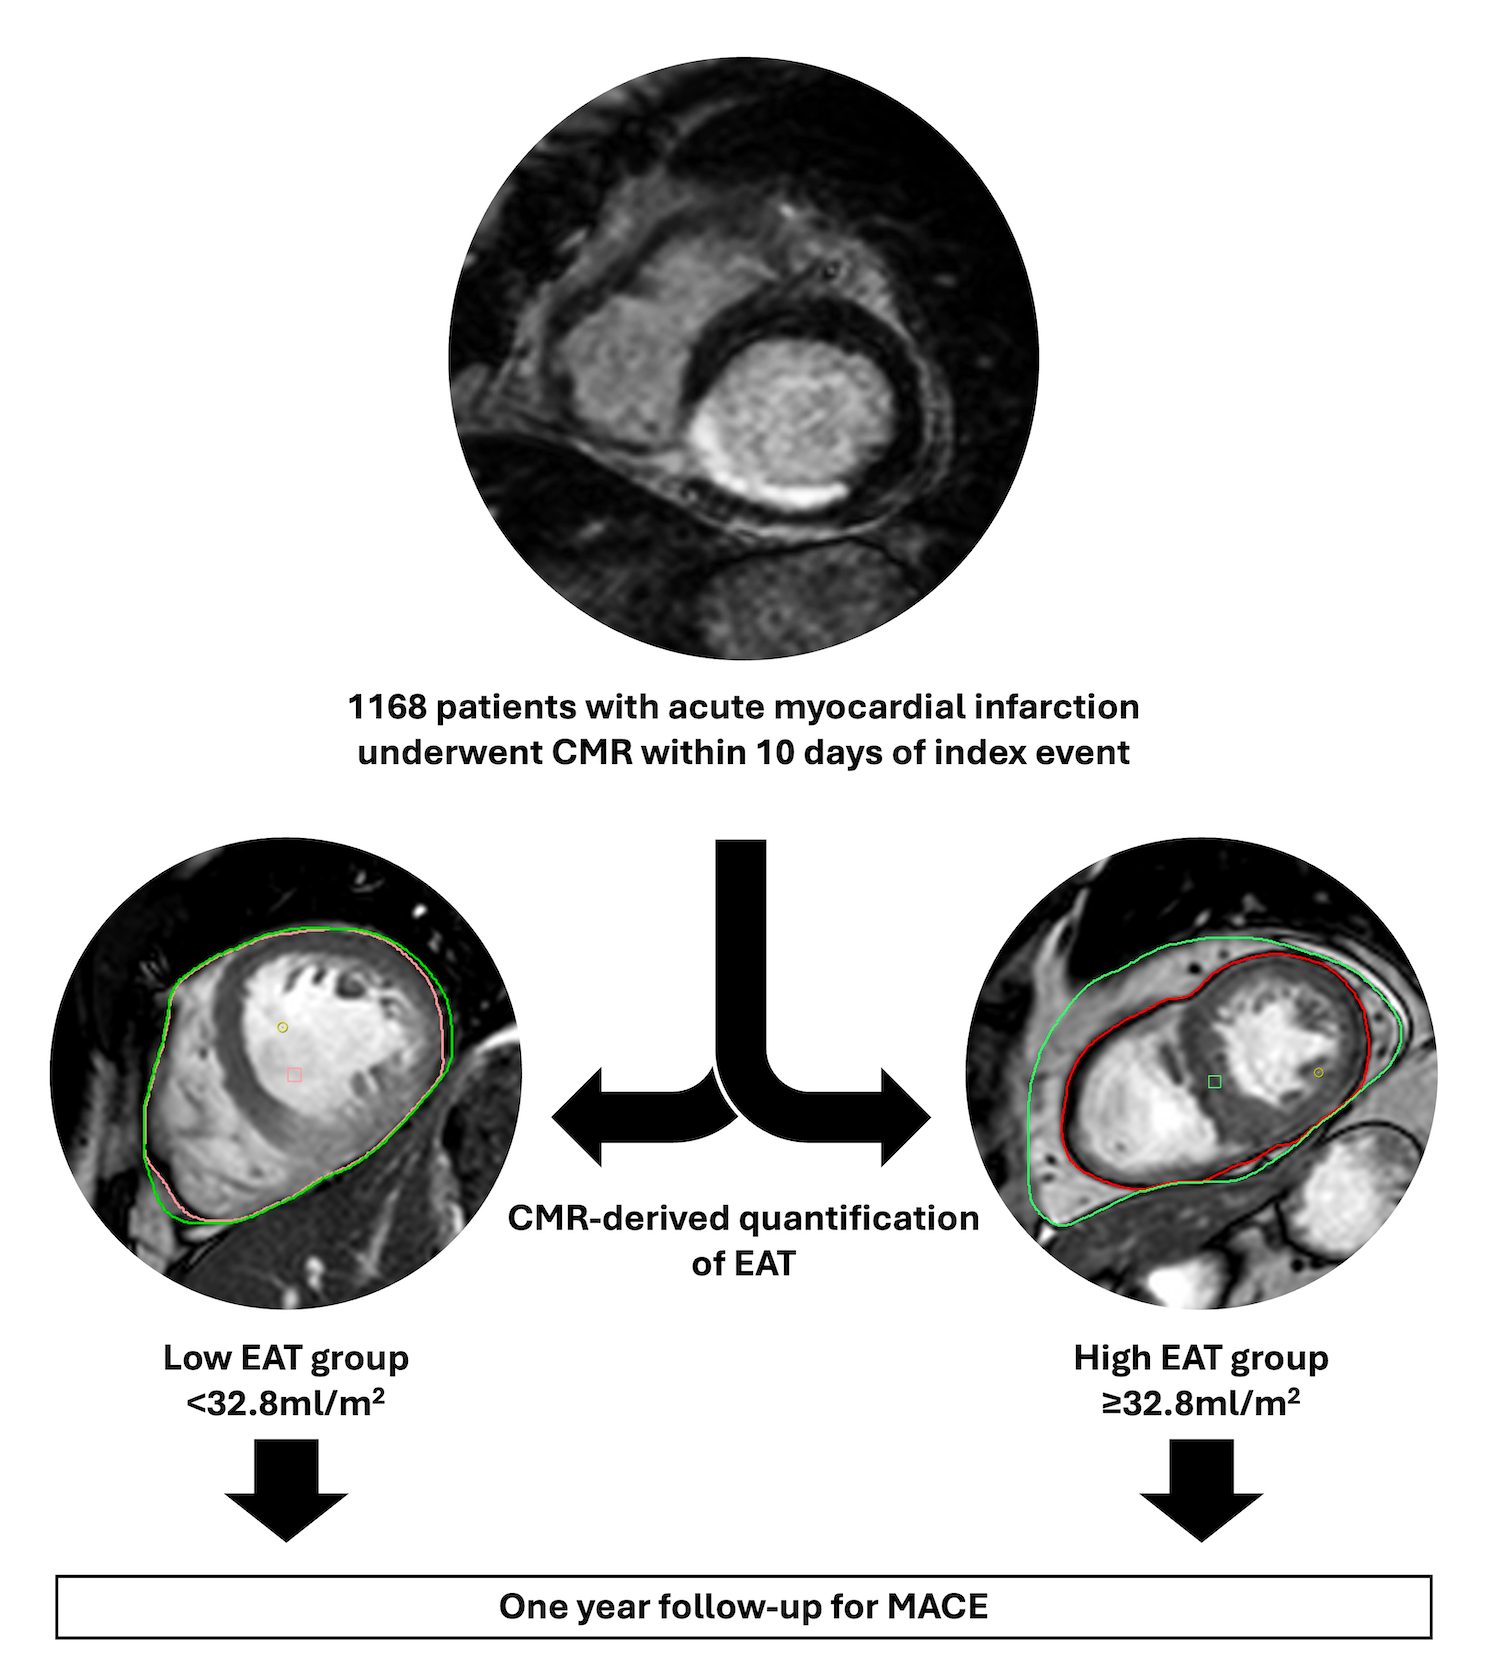
Figure 2A and B: Kaplan-Meyer curves for occurrence of major adverse cardiac events (MACE) after acute myocardial infarction (AMI). (A) shows the occurrence of MACE in patients with low ( <32.8ml/m2) and high EAT volumes (≥32.8ml/m2). (B) indicates the probability of MACE in non-obese and obese patients with high and low EAT volumes. Obesity was defined according to WHO with a BMI ≥30kg/m2. AMI – acute myocardial infarction. EAT – epicardial adipose tissue