Oral Abstract
Xinheng Zhang, PhD
Post-doctoral Scientist
Cedars-Sinai Medical Center
Xinheng Zhang, PhD
Post-doctoral Scientist
Cedars-Sinai Medical Center
Xingmin Guan, PhD
Postdoctorral Fellow
Indiana University
Glen Schmeisser, MSc
Technician
Krannert Cardiovascular Research Center
Khalid Youssef, PhD
Assistant Research Professor
Indiana University, Department of Radiology and Imaging Sciences
Abdul Haseeb Ahmed, PhD
Research Scientist
Siemens Medical Solutions USA, Inc

Behzad Sharif, PhD
Associate Professor of Biomedical Engineering
Purdue University

Rohan Dharmakumar, PhD
Executive Director
Indiana University School of Medicine
Infarcted myocardium evolves over time and its composition in chronic state reflects the nature of myocardial injury at the time of reperfusion. Multiple studies have confirmed that native T1 MOLLI maps at 3T can identify chronic myocardial infarction (MI) based on native T1 differences between infarcted and remote myocardium. However, question surrounding the nature of the substrate identified by the native T1 maps as to whether it is fibrosis or fatty metaplasia has been raised1. Given the complex nature of tissue composition of chronic MI, simple pixel averaging of MI zone in native T1 maps is likely to miss the multi-substrate nature of the infarcted myocardium, which is tied to underlying pathophysiology and prognosis. For example, chronic MIs that are iron rich are laden with proinflammatory burden2 and fatty MIs are prone to arrhythmias3. Hence deciphering the compositional variations among chronic MIs stand to reveal much more than whether the tissue is simply infarcted or not. To examine the compositional differences in chronic MI, as identified by T1 mapping, we used Entropy, a metric that has been previously used to map tissue heterogeneity4. We hypothesized that Myocardial Entropy (ME) could provide insight into substate heterogeneity within infarct zones identified on native T1 that is lost to pixel averaging.
Methods:
We conceptualized 3 Types of chronic MIs that can contribute to complex T1 weightings as summarized in Fig. 1. To characterize the heterogeneity within the native T1 maps, we created reperfused MIs in canines and imaged them at > 6 months after MI (n=14). Native T1 MOLLI maps, mGRE images (to discern iron and fat fraction), and LGE (for MI identification) were acquired at 3T Siemens system. MIs and remote myocardial masks from LGE images and were applied to the T1 maps. Fat fraction (FF) and R2*(=1/T2*) maps were generated using custom-built IDEAL algorithm5 applied to mGRE images. Pixel information of MI regions was derived from native T1 maps and placed into 20 bins to arrive at histograms. ME was calculated on slice-basis as -∑20i=1 pi log2 pi, where p<sub>i is the normalized histogram counts. Histology was used to validate the true composition of chronic MIs (iron, fat and fibrosis).
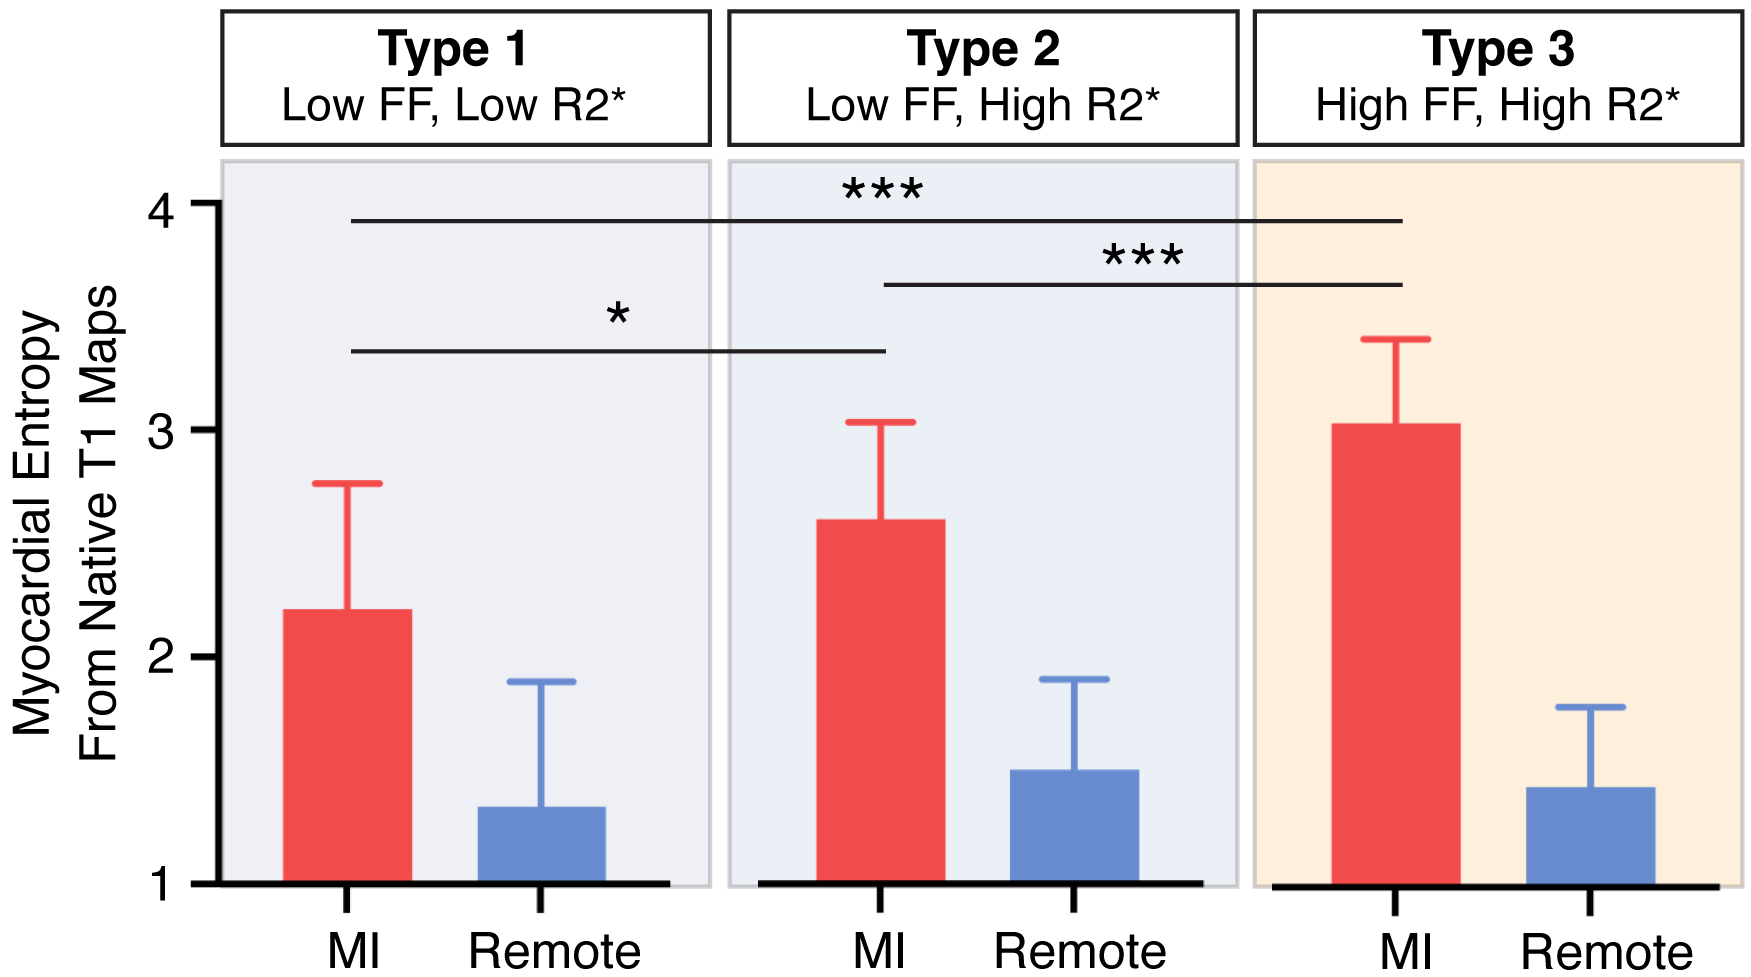
Results: Based on FF and R2* maps, we were able to validate the 3 Types of chronic MIs (Number of samples: 16, 27 and 46 for Type 1, Type 2 and Type 3 respectively) and determine the corresponding ME of MI regions from native T1 maps (Fig. 1B). We found that the MEs were significantly different between the groups and steadily increased from Type 1 to Type 3 (Fig. 2). Histopathology confirmed the compositional heterogeneity determined with ME analysis.
Conclusion:
Myocardial Entropy analysis of native T1 maps can identify increasing heterogeneity of tissue substrates, which opens a new way forward to characterize chronic MIs. While our findings support the notion that not all chronic MIs are the same, additional studies are needed to assess whether Myocardial Entropy of native T1 maps can be used to predict clinical outcomes.
Figure 1. Types of Chronic MIs Based on Substrate Composition. A) A schematic showing chronic MIs with varying compositions classed into three types – Type 1: fibrosis only; Type 2: fibrosis + residual iron deposits from intramyocardial hemorrhage; and Type 3: fibrosis + iron + fatty deposits. B) Examples of the three types of MIs determined from native T1 maps along with infarct heterogeneity estimated based on T1 Entropy (see definition in text) for each Type of chronic MI is shown. Panels show histogram of native T1 values with varying compositions across the three Types of chronic M. FF denotes fat-fraction maps, R2* (=1/T2*) maps can identify iron deposition, and LGE images confirm fibrosis. These observations were validated with histopathology..png)
Figure 2. Myocardial Entropy Determined from Chronic MI territories Identified on Native T1 Maps and Their Relation to the Three Types of Chronic MIs. Bar plot of Myocardial Entropy from Type 1 (fibrosis only): low fat fraction (FF) and low R2* (R2* < 35 ms-1, FF < 4%, N = 13), Type 2 (fibrosis + iron deposition): low FF, high R2* group (R2* > 35 ms-1, FF < 4%, N = 27) and Type 3 (composed of fibrosis, iron and fat deposition): high FF, high R2* group (R2* > 35 ms-1, FF > 4%, N = 46). * denotes P < 0.05 and *** P < 0.001.