Early Career
ADITI GUPTA, MD
FELLOW
Children Hospital of Pittsburgh
Nicolle M. Ceneri, MD
Resident
Children's National Hospital
Nicholas Mouzakis, RT
MR Technologist
Children's National Hospital
PAULA E NORTH, MD, PhD
Professor
Medical College of Wisconsin
Devika Richmann, MD
Pediatric Cardiology Fellow
Columbia/NYP-CHONY
Joshua Kanter, MD
Director Cardiac Catheterization Laboratory
Children's National Medical Center
Tacy Downing, MD
Assistant Professor Pediatrics
Children's National Medical Center
Ravi Vamsee Vegulla, MD
Assistant Professor of Pediatrics
Children's National Medical Center
John Berger, III, MD
Professor of Pediatrics
Children's National Medical Center
Steven Staffa, MSc
Biostatistician
Boston Children's Hospital
David Zurakowski
Professor of Biostatistics
Harvard Medical School
Russell R. Cross, MD
Staff Cardiologist
Nemours Children's Hospital
.png "Laura Olivieri, MD photo")
Laura Olivieri, MD
Associate Professor of Pediatrics
Children's Hospital of Pittsburgh of UPMC
Ravi Vamsee Vegulla, MD
Assistant Professor of Pediatrics
Children's National Medical Center
Cardiovascular magnetic resonance (CMR) derived T1 and T2 parametric mapping can detect allograft rejection in adult heart transplant patients (PHTx) through assessment of myocardial inflammation and edema. Emerging data suggest a role of parametric mapping from CMR in detecting rejection in children. However, the precise pathologic changes present with T1 and T2 elevations in heart transplants are not clearly understood. The aim of the study was to correlate extent of injury in endomyocardial biopsy (EMB) with T1 and T2 values derived from the precise biopsy location in PHTx patients.
Methods:
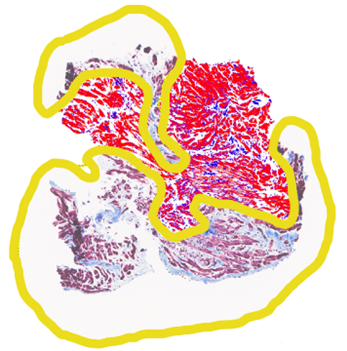
Patients underwent a non-contrast CMR at 1.5 T (Aera, Siemens Erlangen, Germany) including breath-held native modified Look-Locker Inversion recovery (MOLLI) T1 and T2 mapping in eight short-axis slices from base to apex prior to their clinically indicated EMB. Standard septal segmental T1 and T2 values were recorded for the central 6 slices. Following CMR, the EMB site was identified from fluoroscopy-overlay registration, and T1 and T2 values were selected from the precise EMB location. EMB specimens were analyzed according to ISHLT standards, including degree of lymphocytic infiltrate and myocyte damage, and fibrosis percentage was calculated using RGB image analysis, avoiding fibrous caps and perivascular fibrous regions (Figure 2). EMB assessments and imaging measurements were blinded. data are presented a mean ± standard deviation and compared using the student’s t-test and linear regression.
Results:
294 biopsy samples from 94 encounters in 33 PHTx patients (12.8 ± 4.9 years of age, 69% female) were included. Biopsies with > grade 1 myocyte damage had significantly elevated values compared to grade 0 group (T1 1064 ± 40.5 ms vs 1021.9 ± 39.4 ms, p< 0.01) and (T2 55.7 ± 4.5 ms vs 51.7 ± 4.5 ms, p< 0.01). There were no significant differences between the > grade 1 vs grade 0 lymphocytic infiltration for T1 (1022.6 ± 39.4 ms vs 1023.5 ± 39.4 ms, p=0.9 and T2 values (51.5 ± 4.5 ms vs 51.8 ± 4.5ms, p=0.9). Finally, biopsies with high fibrosis ( > 30%) had significantly elevated T1 values compared to low fibrosis group (1030.4 ± 39.4 ms vs 1020.4 ± 39.2 ms, p=0.01).
Conclusion:
While both myocyte damage and lymphocytic infiltration are used to detect clinical rejection on EMB, CMR derived segmental T1 and T2 values strongly correlate with local myocyte damage and fibrosis, and do not correlate with lymphocytic infiltration.
Figure 1 A: Based on the AHA 17 segment method, 2 septal and 1 lateral regions of interest were drawn on 6 short axis slices and T1 and T2 values recorded. Figure 1B: Fluoroscopy AP and lateral images with heart overlay depicting the location of the bioptome and site of septal biopsy – Basal,mid or apical from AP plane and anterior or inferior from Lateral plane.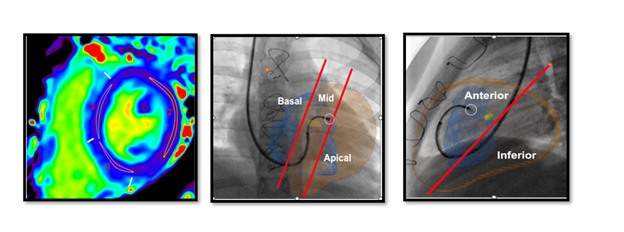
Figure 2: Endomyocardial biopsy specimen with two regions of interest around fibrotic caps and perivascular fibrosis not included in processing (yellow), showing healthy myocardium (red), and intramyocardial fibrosis (blue). Fibrosis value assigned to each biopsy sample using standard software and excluding perivascular fibrosis.