Early Career
Xin Liu, MD
Dr.
Beijing Chaoyang Hosipital, China (People's Republic)

Rene Michael M Botnar, PhD
Director and Professor
Institute for Biological and Medical Engineering
UC Chile, Chile

Claudia Prieto, PhD
Professor and Director for Research and Innovation
School of Engineering, Pontificia Universidad Católica de Chile, Chile
.jpeg "Hsin-Jung Randy Yang, PhD photo")
Hsin-Jung Randy Yang, PhD
Assistant Professor
Biomedical Imaging Research Institute, Cedars-Sinai Medical Center, Los Angeles, CA, USA

Qi Yang, PhD
full professor
Beijing Chaoyang Hospital, Capital Medical University, China (People's Republic)
Background: The ST-elevation myocardial infarction (STEMI) risk stratification by cardiovascular magnetic resonance (CMR) includes myocardial infarction (MI) size and microvascular obstruction (MVO) (1). However, it is usually assessed after injection of contrast agents. We aim to validate a free-breathing three-dimensional (3D) whole-heart cardiac MRI technique, iT2prep‐IR BOOST, for non-contrast MVO detection and myocardial infarction size quantification in STEMI patients.
Methods:
Materials and
Methods: A novel free-breathing multi-contrast 3D whole-heart bright-blood and black-blood sequence (iT2prep‐IR BOOST) provides 3D isotropic whole-heart images with T1/T2 contrast (2). We prospectively included 60 STEMI patients who underwent CMR, including iT2prep‐IR BOOST and late-gadolinium-enhancement (LGE) for MVO and MI assessment, with LGE serving as the gold standard reference. The MVO detection performance of iT2prep‐IR BOOST was qualitatively evaluated compared with LGE; its ability to quantify myocardial damage (e.g., MI, MVO, and edema) was assessed. Subgroup analyses investigated the association of MVO, assessed by non-enhanced iT2prep‐IR BOOST, with ventricular remodeling over a 6-month period.
Results:
Results: T2prep-IR BOOST correctly identified MVO in all 44 patients (100% sensitivity) and correctly ruled out MVO in 14 of 16 patients (88% specificity). Among 960 AHA segments, T2prep-IR BOOST correctly identified MVO in 147 of 148 (99% sensitivity) and correctly ruled out MVO in 805 of 812 (99% specificity) (Figure 1). 3D iT2prep-IR BOOST and 2D routine clinical sequences in STEMI patients with and without MVO (Figure 2). Quantitative analysis revealed a strong correlation (regression line: Y = 1.11X + 0.67, p < 0.001; regression line: Y = 0.97X + 1.54, p < 0.001) between T2prep-IR BOOST and LGE images regarding MVO and MI volume measurements (Figure 3). Among 37 patients who underwent follow-up, a correlation was observed between the MVO volume assessed using T2prep-IR BOOST images and ΔLVEDVI (regression line: Y = 1.02X + 2.72, p = 0.004).
Conclusion:
Conclusions: The iT2prep‐IR BOOST sequence demonstrates high sensitivity and specificity in the detection and characterization of AMI and MVO. Thus, it is a viable alternative for myocardial injury imaging in patients with STEMI who are contraindicated for LGE CMR.
Figure 1 Detection performance of iT2prep-IR BOOST in MVO. Abbreviations: PPV, positive predictive value; NPV, negative predictive value; MVO, microvascular obstruction.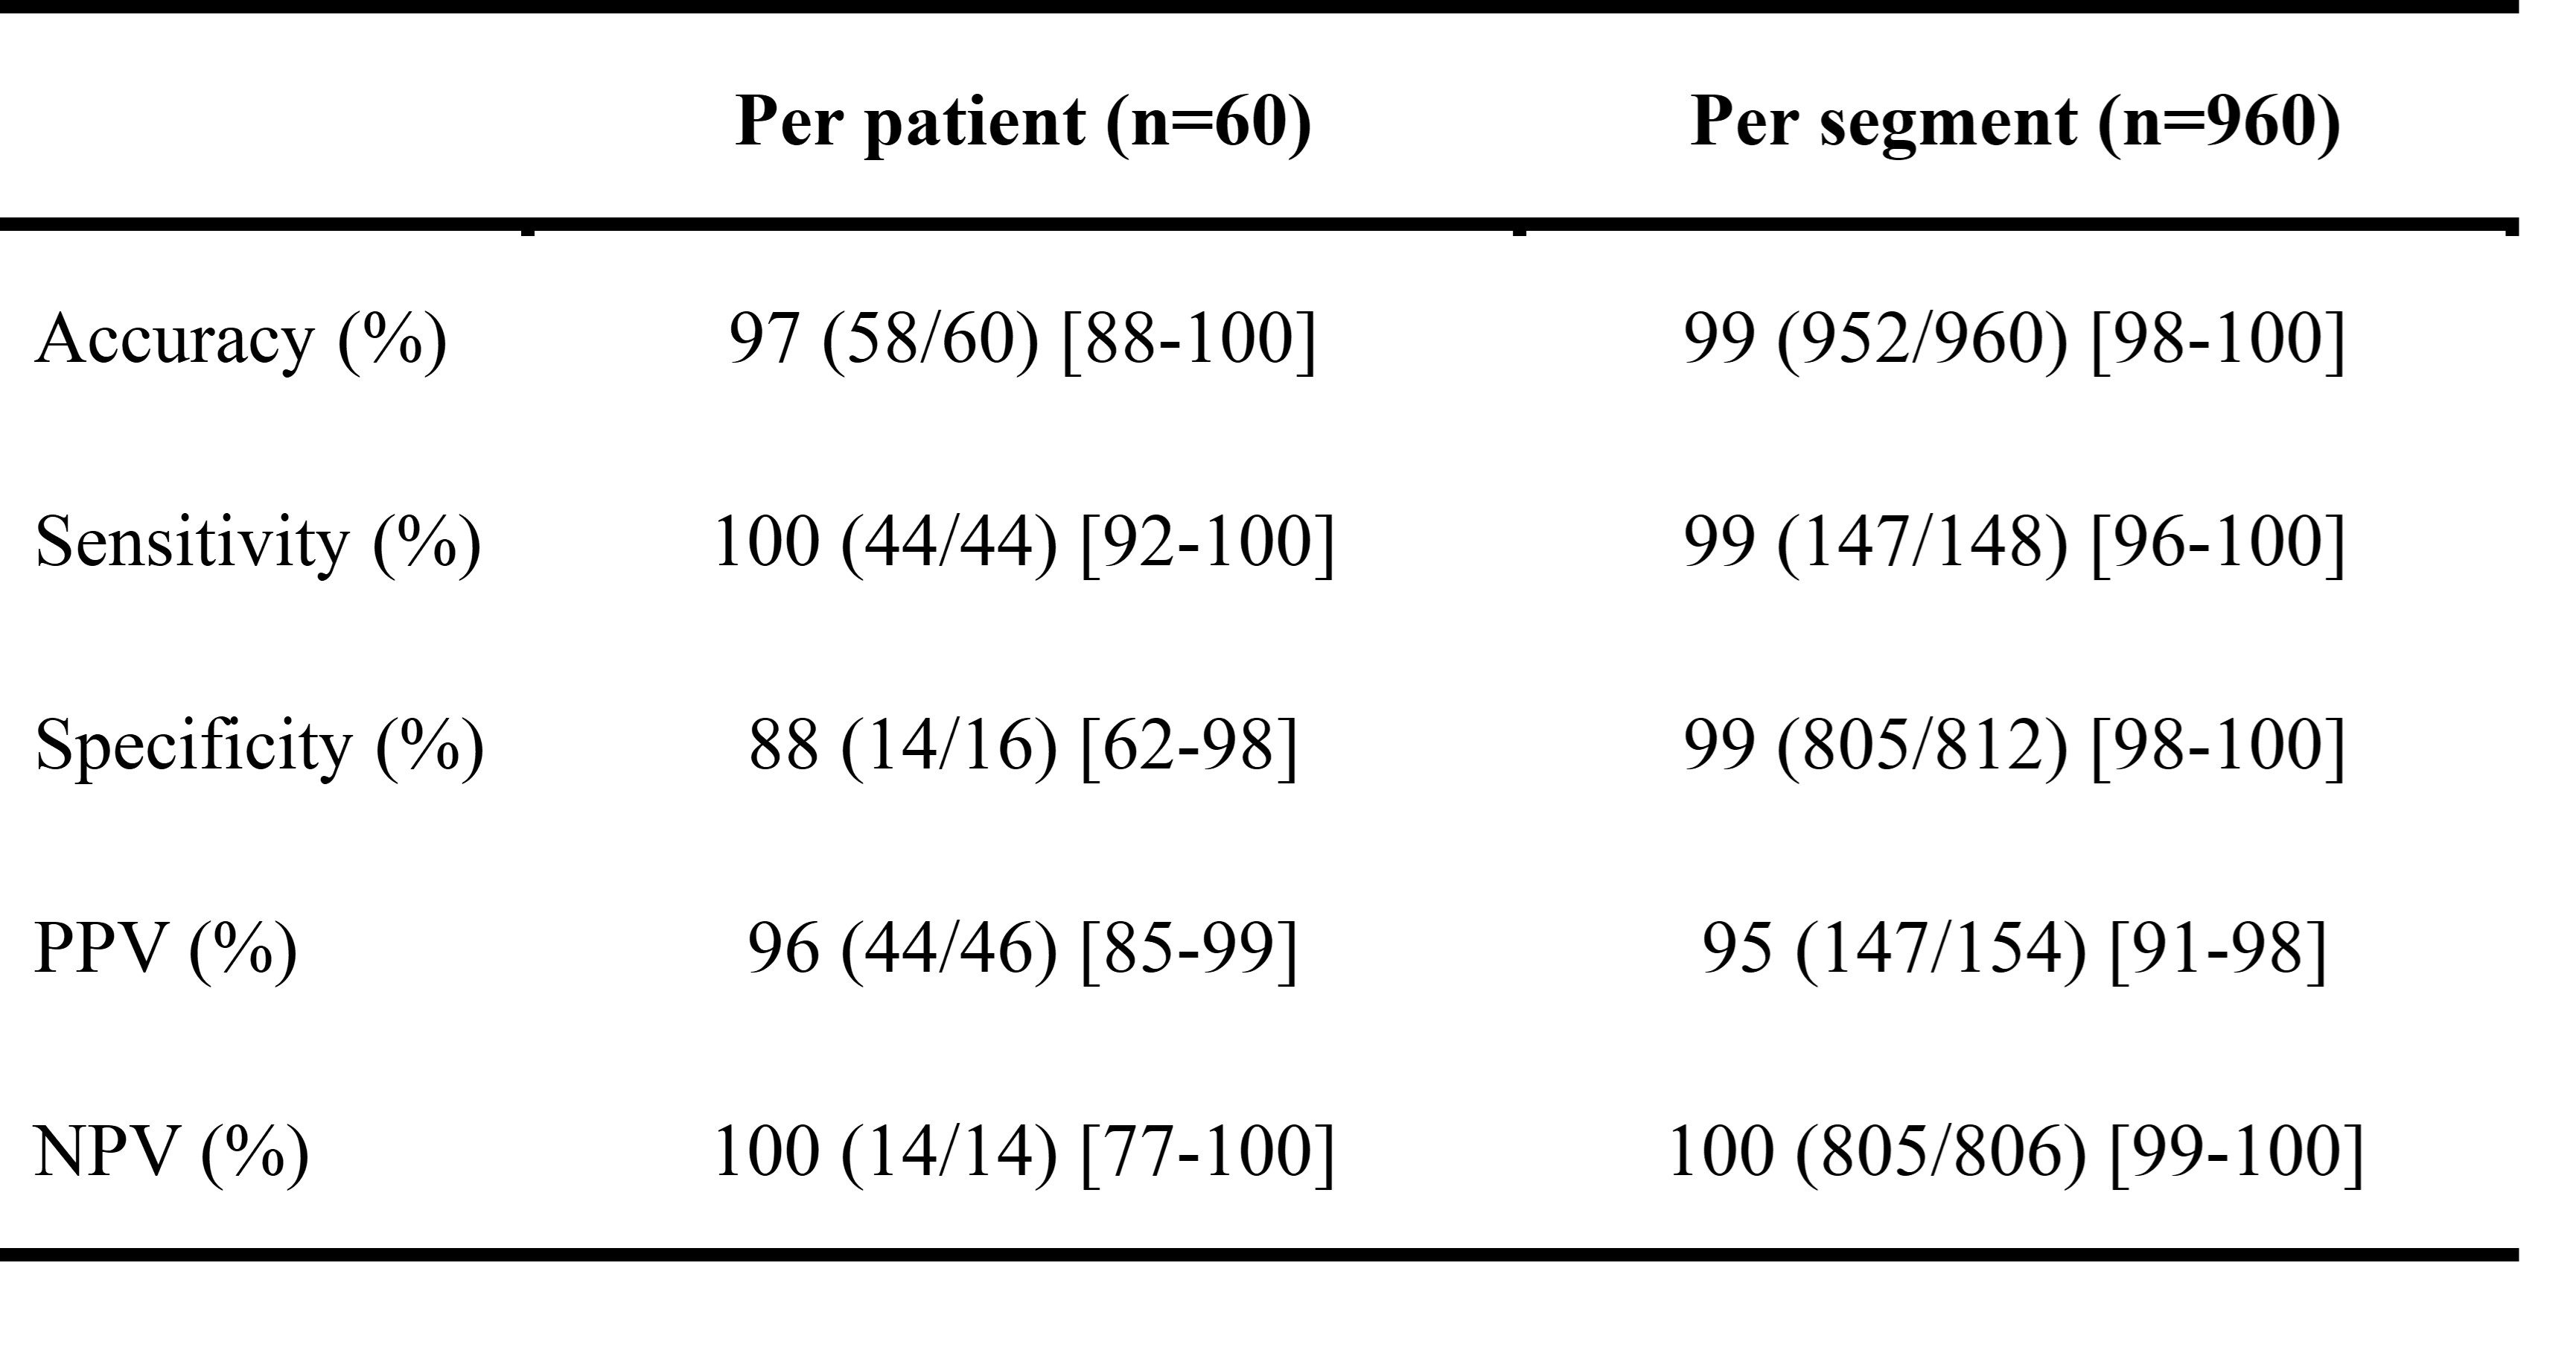
Figure 2 3D iT2prep-IR BOOST and 2D routine clinical sequences in STEMI patients with and without MVO. Panel A: Male patient, 37 years old, anterior myocardial infarction with MVO, 5 days after PCI. Representative iT2prep-IR BOOST images, LGE, and EGE images in a STEMI patient with MVO (red arrow). Panel B: Male patient, 47 years old, anterior myocardial infarction without MVO, 7 days after PCI. Representative iT2prep-IR BOOST images, LGE, and EGE images in a STEMI patient without MVO. Abbreviations: STEMI, ST-segment elevation myocardial infarction; MVO, microvascular obstruction; LGE, late-gadolinium-enhancement; EGE, early-gadolinium-enhancement. 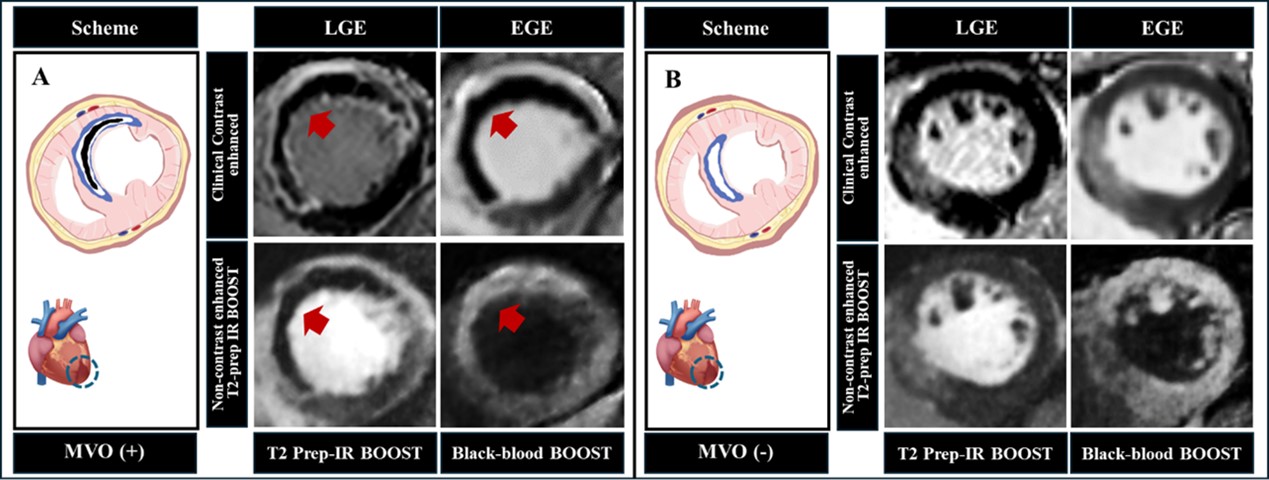
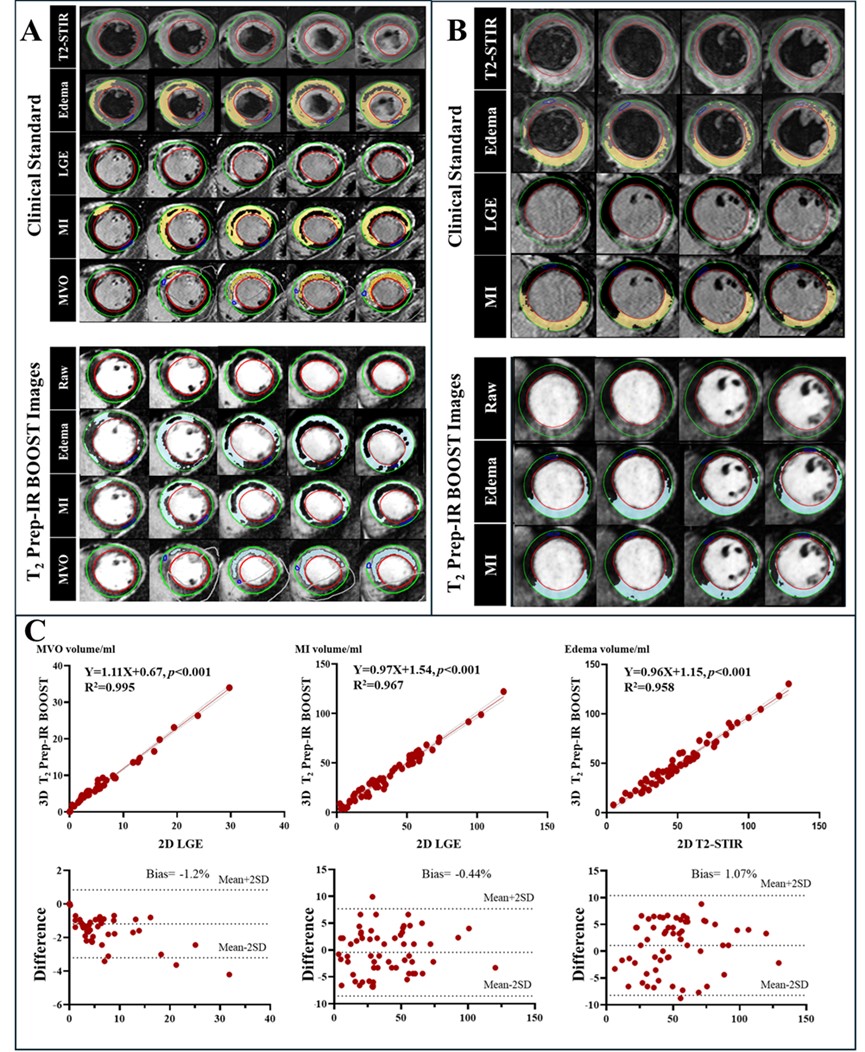
Figure 3 MVO, MI, and edema volumes: T2prep-IR BOOST vs. LGE or T2-STIR images and representative cases. Panel A: Images of a 37-year-old man with anterior myocardial infarction and MVO. Lines 1, 3, and 6 show original images of T2-STIR, LGE, and T2prep-IR BOOST, respectively. Edema areas were identified on both T2-STIR images (line 2: yellow highlights) and T2prep-IR BOOST images [line 7: blue highlights: mean (remote area) + 3SD]. MI areas were identified on both LGE images (line 4: yellow highlights) and T2prep-IR BOOST images [line 8: blue highlights: mean (remote area) + 6SD]. MVO areas were identified on both LGE images (line 5: yellow highlights) and T2prep-IR BOOST images [line 9:blue highlights: mean (infarcted area) - 6SD]. Panel B: Images of a 68-year-old man with anterior myocardial infarction but no MVO. Lines 1, 3, and 5 show original images of T2-STIR, LGE, and T2prep-IR BOOST, respectively. Edema areas were identified on both T2-STIR images (line 2: yellow highlights) and T2prep-IR BOOST images [line 5: blue highlights: mean (remote area) + 3SD]. MI areas were identified on both LGE images (line 3: yellow highlights) and T2prep-IR BOOST images [line 7: blue highlights: mean (remote area) + 6SD]. Panel C: Line 1: Comparison of MVO, MI, and edema volume measurements using 3D T2prep-IR BOOST and conventional two-dimensional LGE or T2-STIR images. Line 2: Bland-Altman plot comparing measurement results obtained with these two imaging techniques. Abbreviations: MVO, microvascular obstruction; MI, myocardial infarction; LGE, late-gadolinium-enhancement; T2-STIR, T2-weighted short-tau inversion recovery; SD, standard deviation.