Clinical & Translation
Nikita Nair, BSc
Clinical Research Assistant
The Ohio State University
Nikita Nair, BSc
Clinical Research Assistant
The Ohio State University
Rui Li, PhD
Research Associate
Norwich Medical School, United Kingdom
Gareth Matthews, PhD, MB
NIHR Clinical Lecturer
Norwich Medical School, United Kingdom

Orlando P. Simonetti, PhD
Professor
The Ohio State University

Juliet Varghese, PhD
Research Assistant Professor
The Ohio State University

The increasingly paramagnetic nature of blood with deoxygenation provides the sensitivity to estimate blood oxygen (O2) saturation non-invasively by CMR. Non-invasive CMR assessment of intra-ventricular O2 saturation, traditionally obtained by invasive catheterization, could enhance CMR diagnostic capabilities (1). The purpose of this study was to investigate the use of a commercially available myocardial T2 mapping protocol to estimate intra-ventricular blood pool O2 saturation. This study was conducted in patients with normal CMR findings and those having heart failure with preserved and reduced ejection fraction (HFpEF and HFrEF), where the arterio-venous difference in saturation [(a-v)O2] is expected to vary between the groups.
Methods:
The three single-shot T2-prepared bSSFP source images (T2 preparation time = 0, 25, and 55 ms) from a commercial myocardial T2 mapping protocol were retrospectively used to estimate intra-ventricular O2 saturation in three patient groups: Normal CMR findings (n = 19), HFpEF (n = 18) and HFrEF (n = 17). All images were acquired at 1.5 T (MAGNETOM Sola, Siemens Healthineers, Forchheim, Germany) in a mid-short axis view. Using the arterial O2 saturation from a finger pulse oximeter as a small regional reference for the left ventricle (LV) and the hematocrit as a patient-specific reference, a pixel-wise O2 saturation map was generated using the Luz-Meiboom model (1,2). O2 saturation was determined in regions of interest in the left and right ventricles. Similar ROIs were also drawn in the myocardial T2 maps to determine the O2 sensitivity of the blood T2 time (3). Cardiac function was also assessed from breath-held segmented 2D cine. Scheffe pairwise comparison test was performed to assess significant differences in O2 sensitivity and LVCO across groups.
Results:
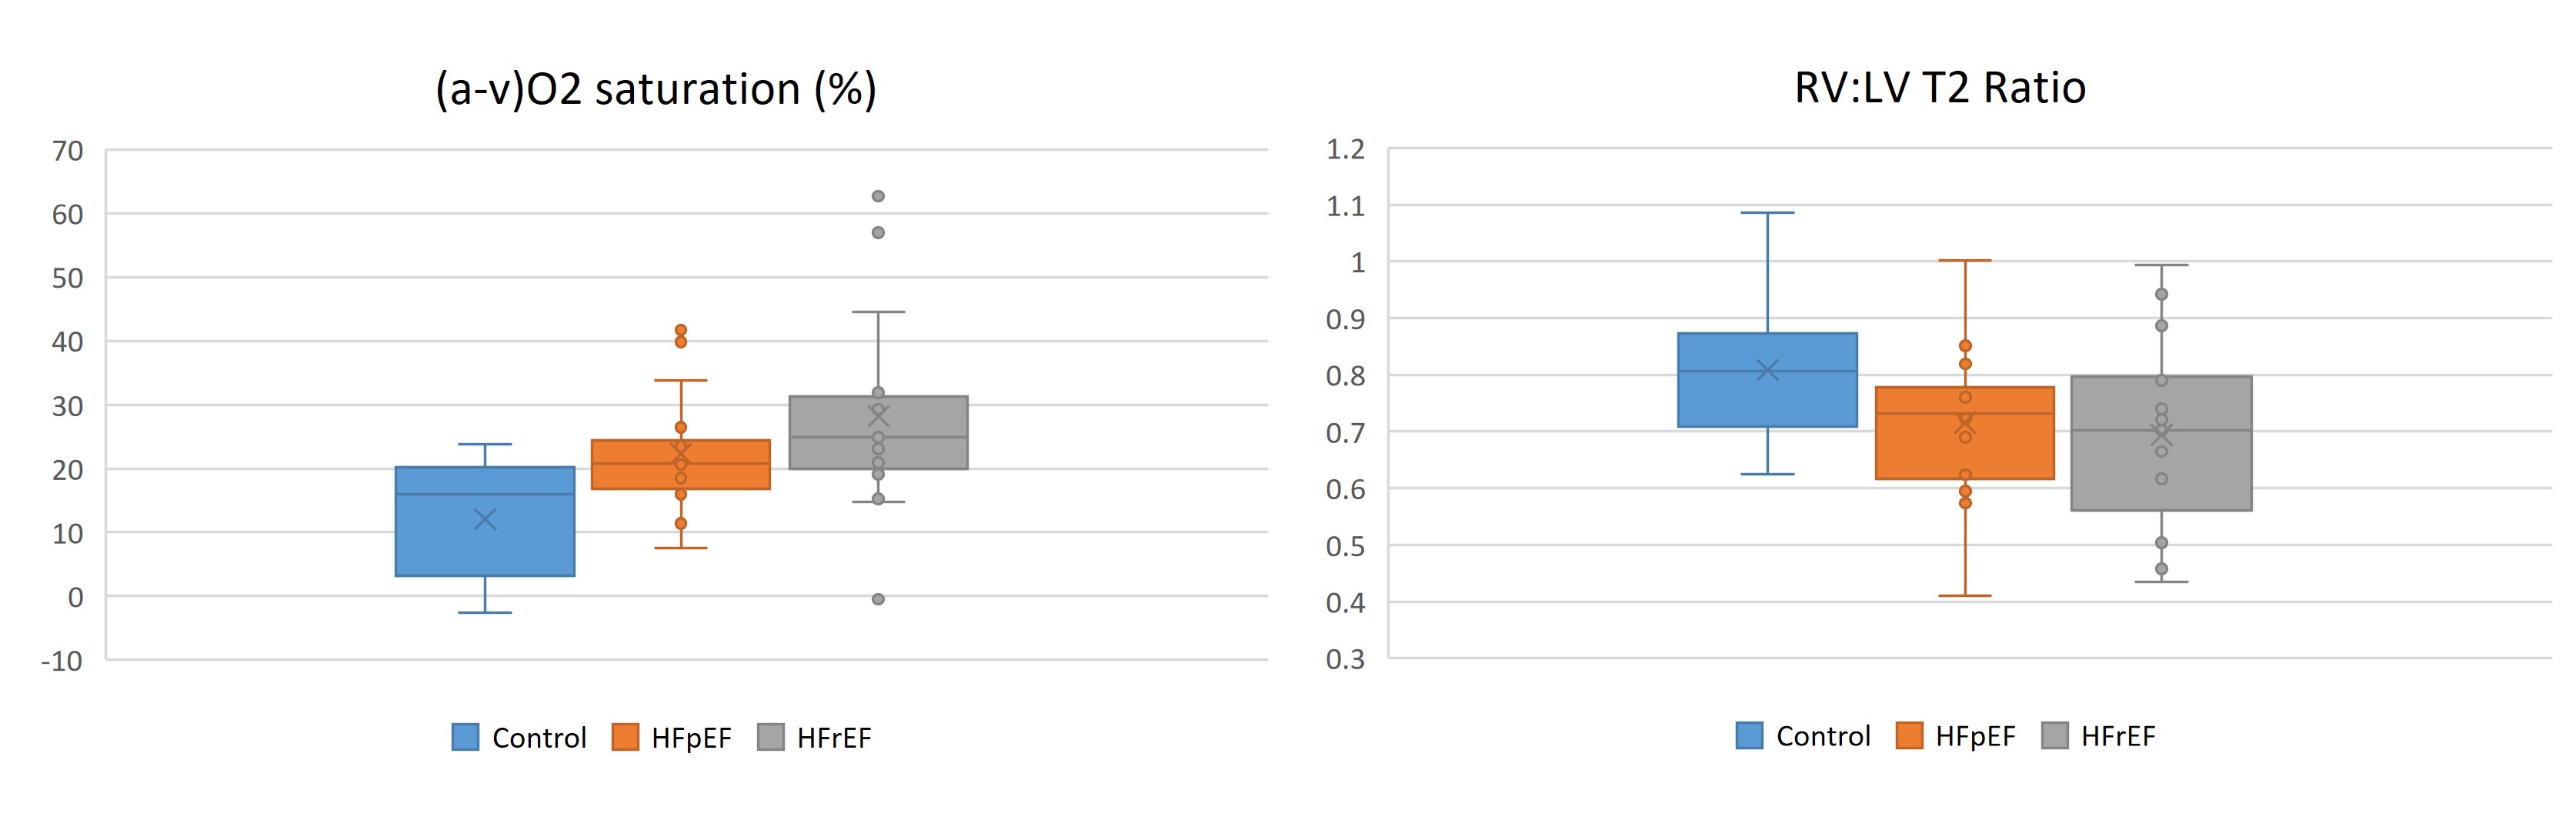
Representative myocardial T2 and O2 saturation maps are shown in Figure 1. Patient characteristics are described in Table 1. LVCO of HFrEF (4.87 ± 1.42 L/min) was significantly lower (p = 0.003) than the controls(6.46 ± 1.70 L/min), but not for HFpEF (5.35 ± 1.24 L/min). (a-v)O2 saturation for HFpEF (23.15 ± 9.24%) and HFrEF (27.69 ± 14.96%) groups were significantly higher compared to controls (12.04 ± 9.76%, p< 0.001), but not between the two heart failure groups. RV:LV T2 ratios for controls (0.81 ± 0.13), HFpEF (0.69 ± 0.14), and HFrEF (0.70 ± 0.16) were not significantly different across groups (Figure 2).
Conclusion:
The feasibility of MR-based estimation of O2 saturation is demonstrated using a standard myocardial T2 mapping protocol in patient groups with expected (a-v)O2 saturation differences. As reduced cardiac output is compensated by increased oxygen extraction in heart failure, non-invasive assessment of (a-v)O2 saturation in conjunction with cardiac function may provide more sensitive and additional insights into disease phenotypes. Further prognostic studies are warranted to validate the use of a standard myocardial T2 mapping protocol for oximetry evaluation.
Figure 1. Top row shows myocardial T2 maps (windowed to highlight right and left ventricle blood pool T2 differences) while bottom row shows the corresponding O2 saturation maps estimated from the T2 prepared source images in three patients - with normal CMR findings (LVEF 67%, CO 8.7 L/min), with HFpEF (LVEF 46%, CO 4.2 L/min) and with HFrEF (LVEF 22%, CO 3.4 L/min). Arterial (LV) T2 and O2 saturation are indicated within the red box. Venous (RV) T2 and O2 saturation values are indicated in the blue box.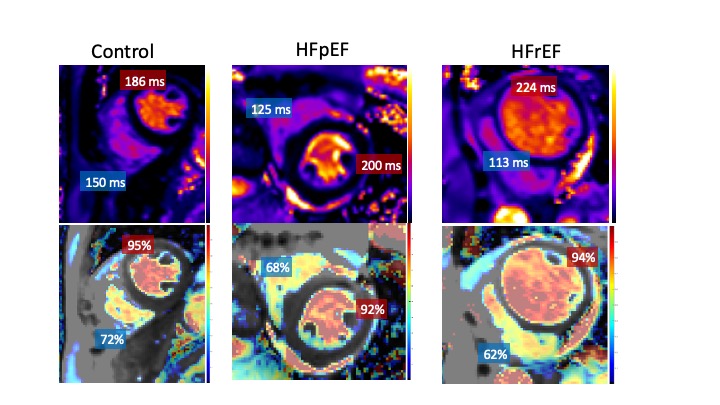
Figure 2. (a-v) O2 saturation difference between left and right ventricle (LV and RV) estimated by MR oximetry and corresponding RV:LV blood T2 ratio in three patient groups with normal CMR findings (control), heart failure with preserved and reduced ejection fraction (HFpEF and HFrEF).