Oral Abstract
Pauline Gut, MSc
PhD student
University Hospital (CHUV) and University of Lausanne (UNIL), Switzerland
Pauline Gut, MSc
PhD student
University Hospital (CHUV) and University of Lausanne (UNIL), Switzerland
Hubert Cochet, MD, PhD
Professor
Department of Cardiovascular Imaging, Hôpital Cardiologique du Haut-Lévêque, CHU de Bordeaux, France
Frederic Sacher, MD, PhD
Professor
Department of Cardiovascular Imaging, Hôpital Cardiologique du Haut-Lévêque, CHU de Bordeaux, France
Pierre Jaïs, MD, PhD
PROF/PhD
Hôpital Cardiologique du Haut-Lévêque, CHU de Bordeaux, France

Mathias Stuber, PhD
Full Professor
CIBM-CHUV-UNIL
Laussane University, Switzerland

Aurelien Bustin, PhD
Assistant Professor
IHU LIRYC, France
Data: Eight healthy volunteers (2 females, age: 26±6y, range: 22-39y) were scanned at 1.5T (MAGNETOM Aera, Siemens). Three short-axis slices covering the heart at the basal, mid-ventricular, and apical levels were acquired during end-expiration in mid-diastole using both conventional3 and wideband T2 mapping (Fig.1). These acquisitions were performed with and without an ICD (St. Jude Medical, Quadra Assura, model CD3265-40Q) placed below the left clavicle, approximately 10 cm from the heart.
Sequence: The T2 preparation module4 (duration=0, 27, 55ms) consisted of two adiabatic hyperbolic secant refocusing pulses of 1.6 kHz and 5.0 kHz2 for conventional and wideband T2 mapping, respectively. Otherwise, matching sequence parameters were: resolution=1.4mmx1.4mm, slice thickness=8mm, FA=15°, GRAPPA x2, partial Fourier phase 6/8, TE/TR=2.09/3.95ms, readout bandwidth=1221Hz/pixel, FOV=360mmx287mm, and gradient recalled-echo (GRE) readout.
Analysis: T2 maps were reconstructed online using a 2-parameter (M0 and T2) fitting model3. For all slices, myocardial T2 values were manually extracted in the anterior, lateral, inferior, and septal segments using MATLAB. Repeated measurements ANOVA and pairwise comparisons with Bonferroni correction were performed in R to compare T2 values between sequences.
Results:
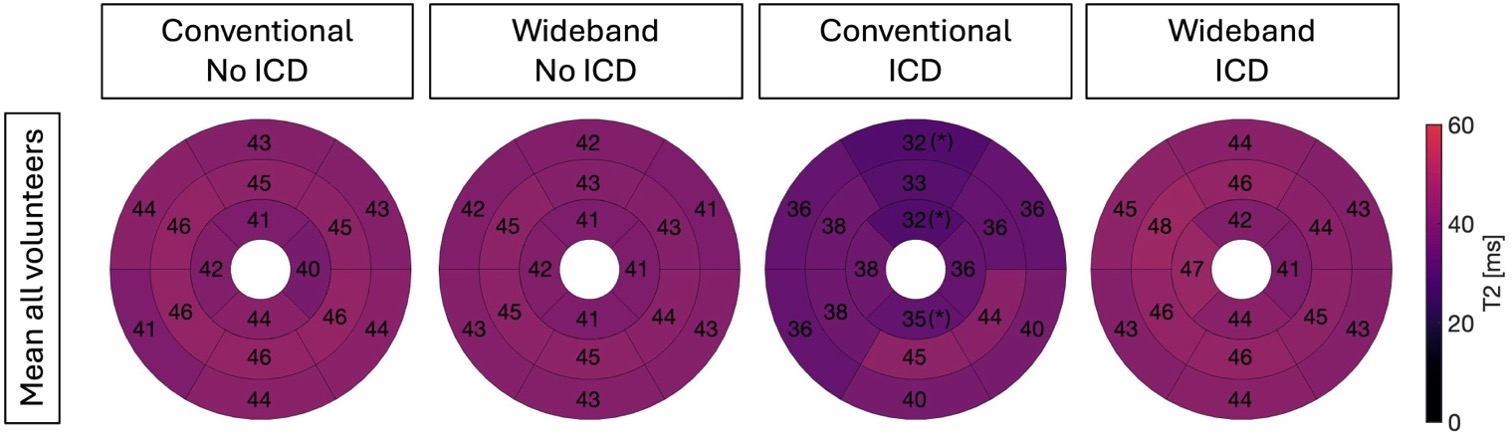
An example of T2 maps obtained with and without ICD is shown in Fig2. In the absence of an ICD, T2 values were similar between conventional (mean: 43.5, SD: 2.21) and wideband technology (mean: 44.0, SD: 2.15, P=0.111). In the presence of an ICD, T2 values were significantly reduced with the conventional sequence (median: 36.4, SD: 5.91, P< 0.01), with the apical anterior, apical inferio, mid-ventricular anterior, and basal anterior segments being the most affected (Fig3). However, using a wideband T2 preparation, ICD-related artifacts affecting the myocardium were suppressed allowing for accurate T2 values (mean: 42.7, SD: 1.91), consistent with conventional T2 values observed in the absence of an ICD (P=0.377).
Conclusion:
Conventional myocardial T2 mapping is significantly affected by ICD-related artifacts, leading to inaccurate T2 values. In contrast, wideband T2 mapping mitigates these artifacts, providing accurate myocardial T2 measurements even when an ICD is present.
Fig1: Sequence diagram of the investigated wideband myocardial T2 mapping. Three wideband T2-prepared single-shot images are acquired sequentially with increasing T2 preparation duration (0, 27, and 55 ms). A two-parameter exponential fitting model is then employed to generate the T2 maps.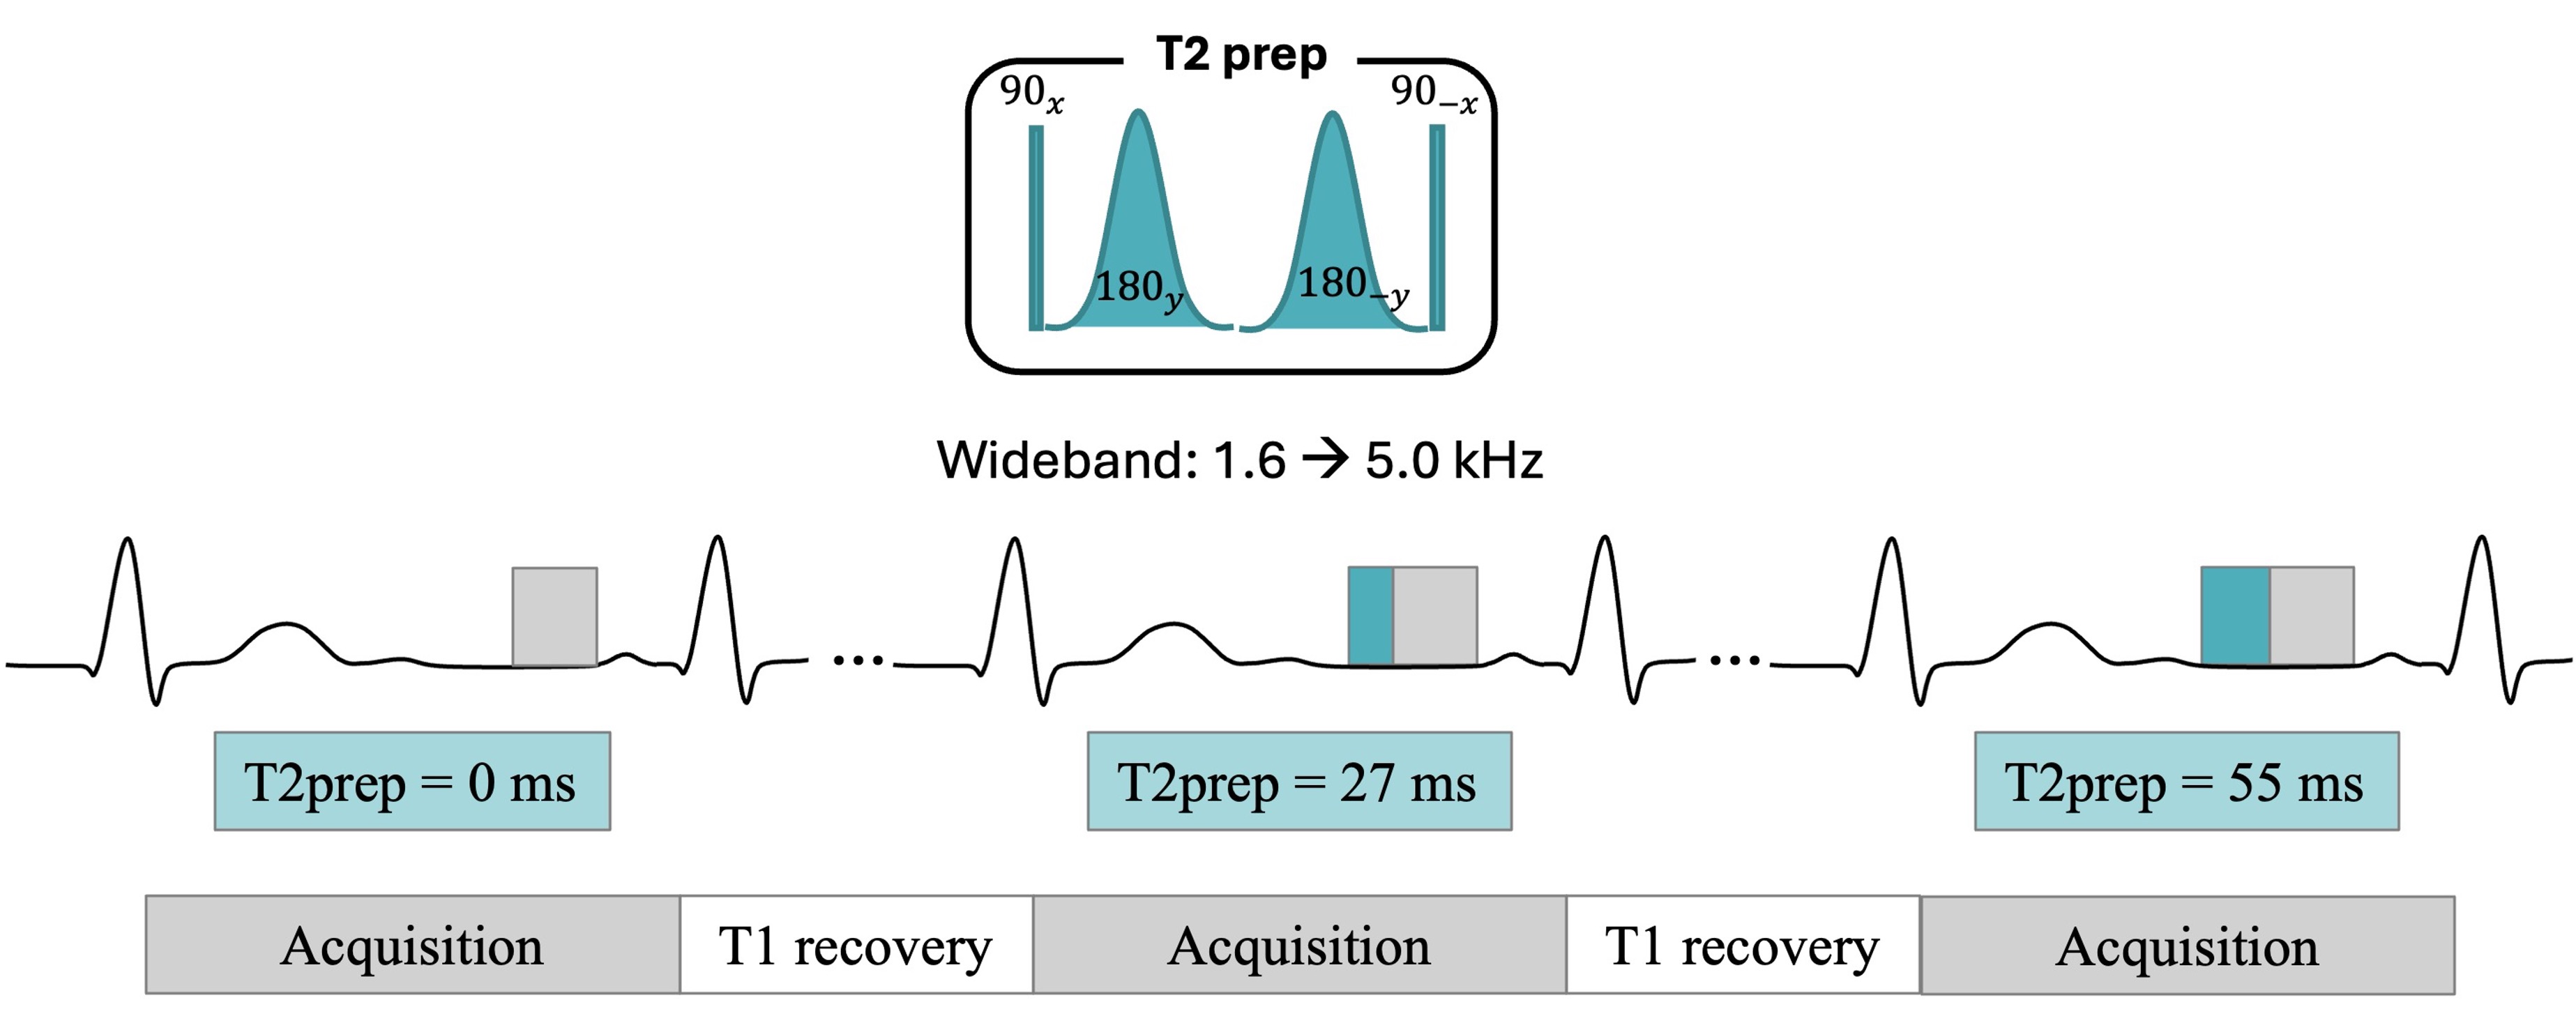
Fig2: Conventional and wideband T2 maps obtained in a healthy subject with and without an ICD.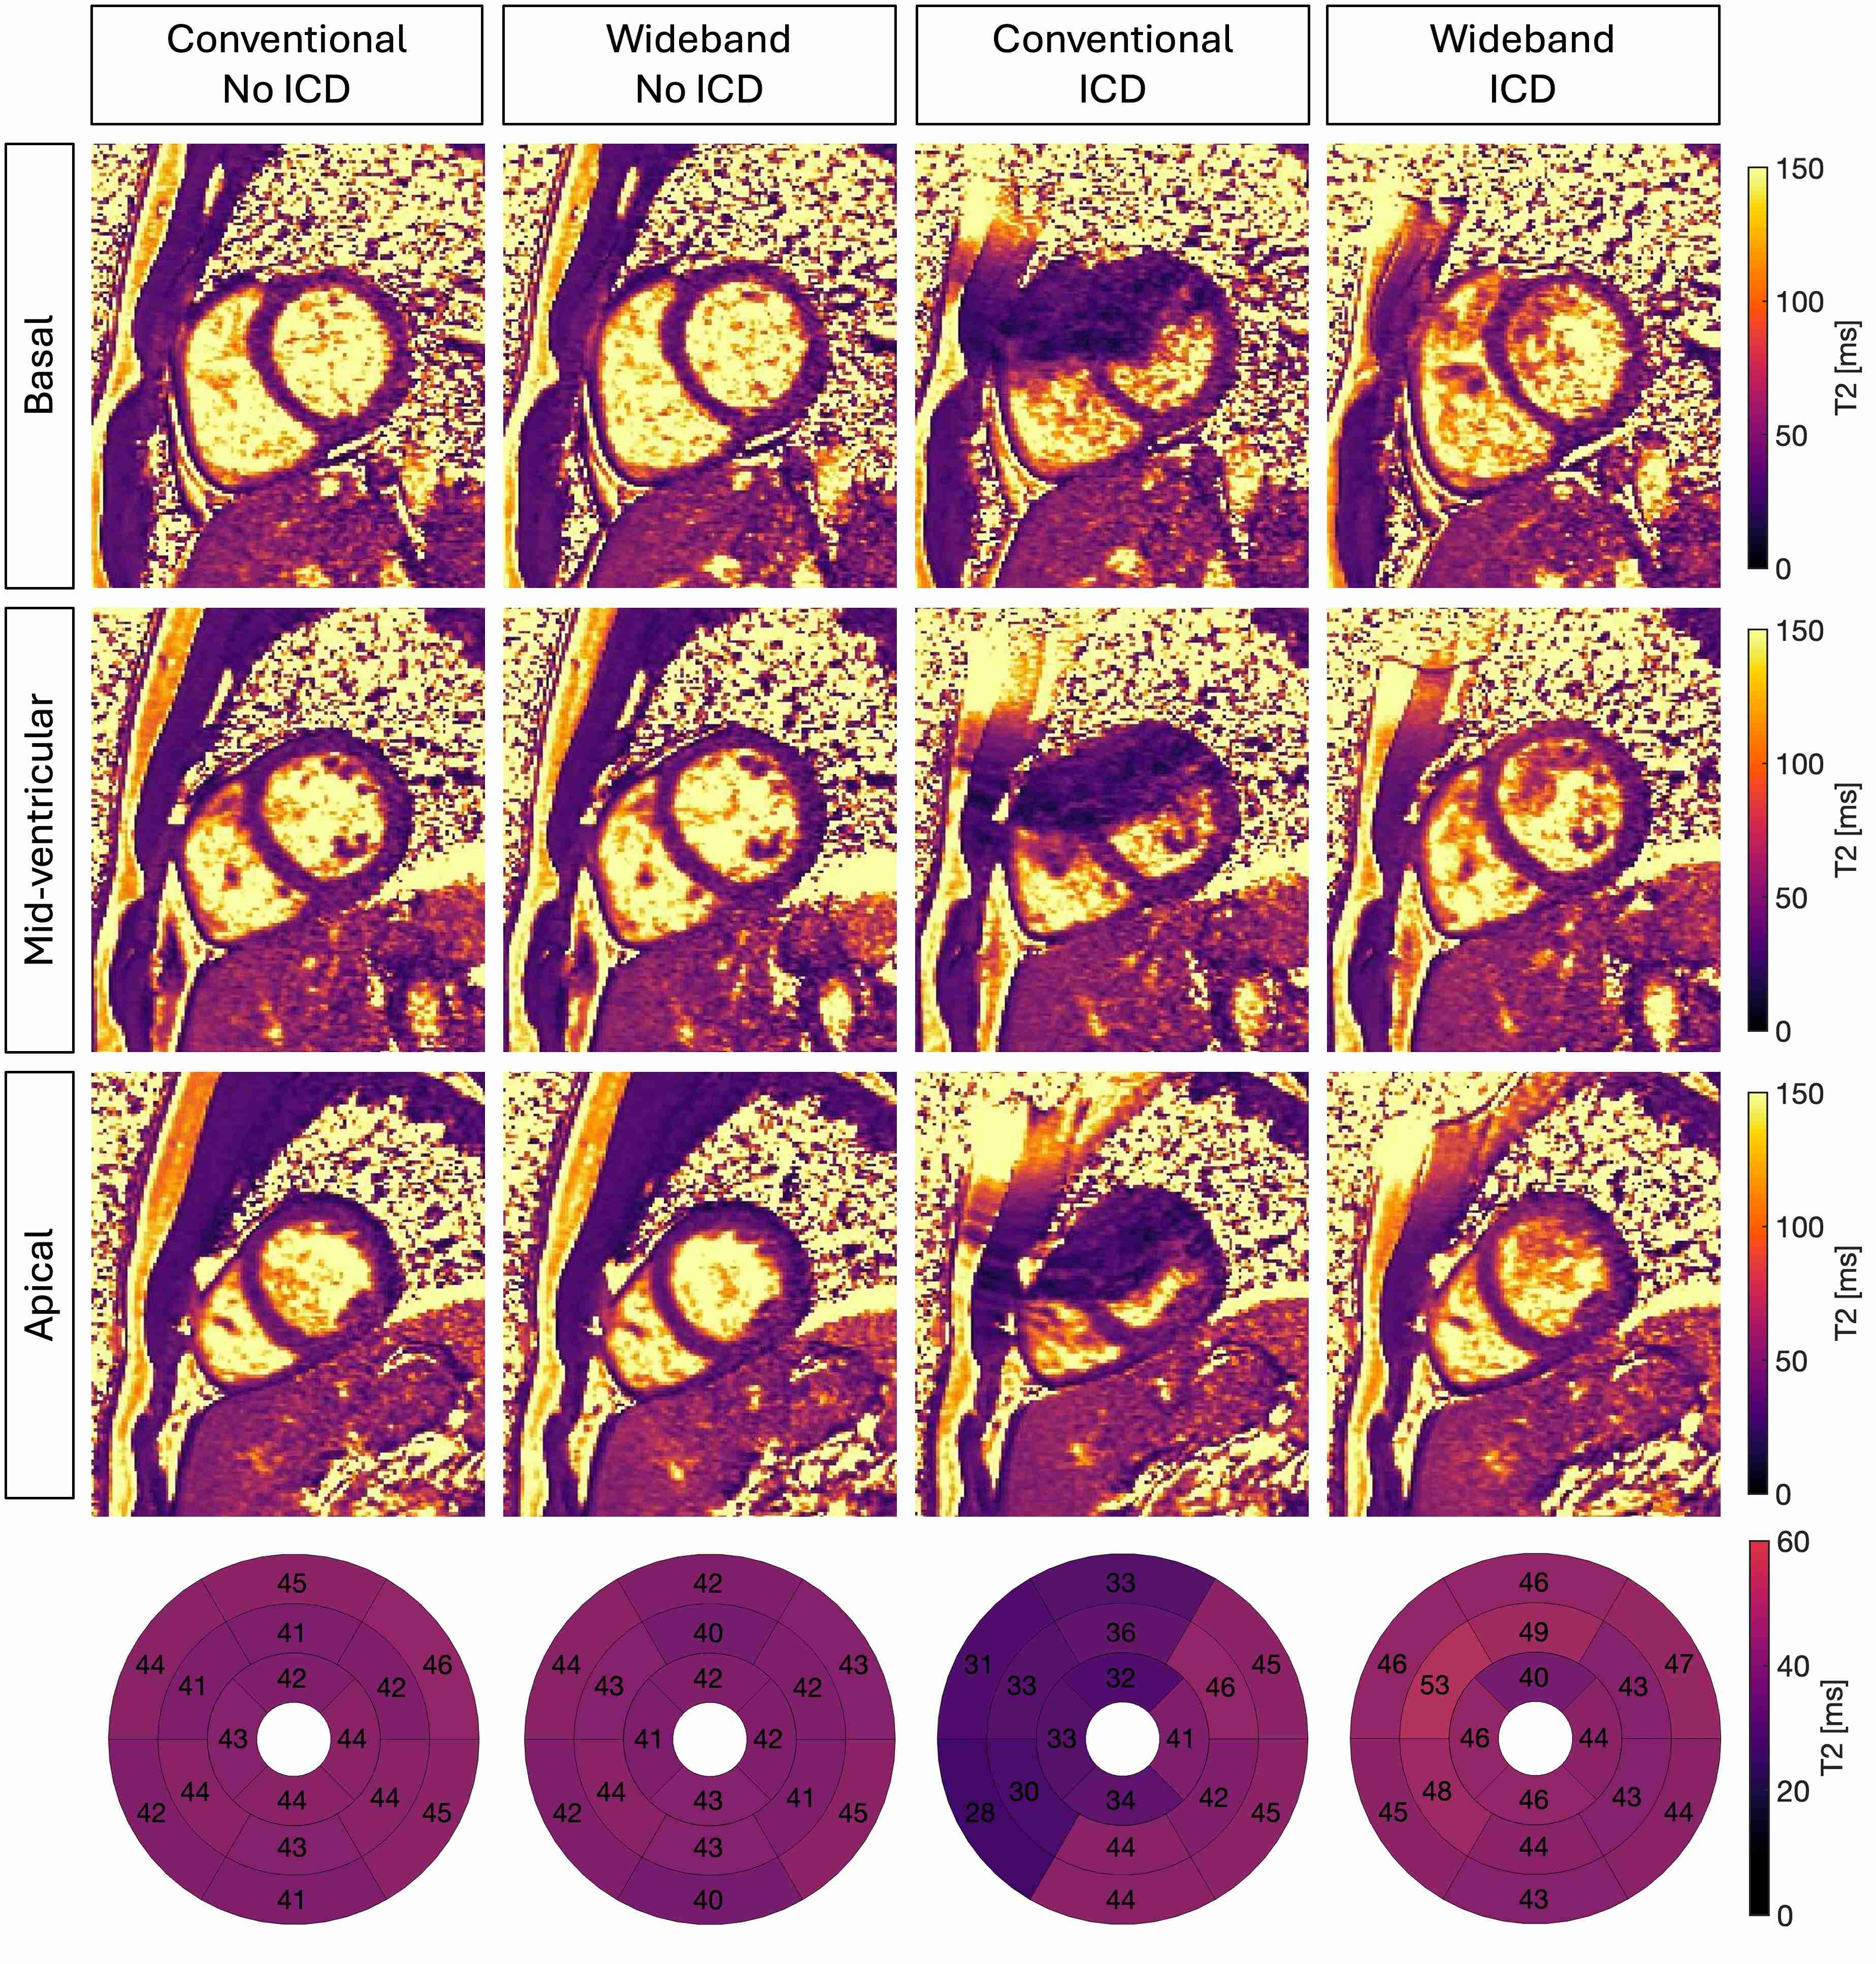
Fig3: Segmental analysis of myocardial T2 values obtained with different sequences with and without ICDs. Mean T2 values that are significantly different from T2 values obtained with conventional T2 mapping without ICD are highlighted by an asterisk (*).