Early Career
Nina Castor, MSc
Medical student
Karolinska Institutet, Sweden
Nina Castor, MSc
Medical student
Karolinska Institutet, Sweden
Eric E. Morgan, MD, PhD
Clinical Fellow
National Heart, Lung, and Blood Institute, National Institutes of Health
Björn Wieslander, MD, PhD
MD PhD
Karolinska Institutet, Sweden

Gaby Weissman, MD
Physician
Medstar Washington Medical Center

Adrienne Campbell-Washburn, PhD
Staff Scientist
National Heart, Lung, and Blood Institute, National Institutes of Health

Felicia Seemann, PhD
K99 Investigator
National Heart, Lung, and Blood Institute, National Institutes of Health
NIH
We imaged 69 patients undergoing a clinically indicated cardiac MRI due to known or suspected cardiovascular disease and 18 healthy controls with IRB approval. Patients were divided into 3 groups based on their ejection fraction (EF); those with EF< 50%, EF >50%, and those without clinical findings in their MRI. Additionally, we compared patients with a clinical heart failure diagnosis grouped according to NYHA classification.
Lung images were acquired with a self-gated 3D proton density-weighted gradient echo MRI sequence (TE/TR/θ=0.7ms/5ms/1°, 1.5ms readout, 3.5x3.5x3.5mm resolution, FOV 450x450x252mm, 2.5min acquisition time) at 1.5T (MAGNETOM Sola, Siemens), with a respiratory-binned image reconstruction3-5. LWD maps were derived with established methods3-4 using a neural network-based lung segmentation.
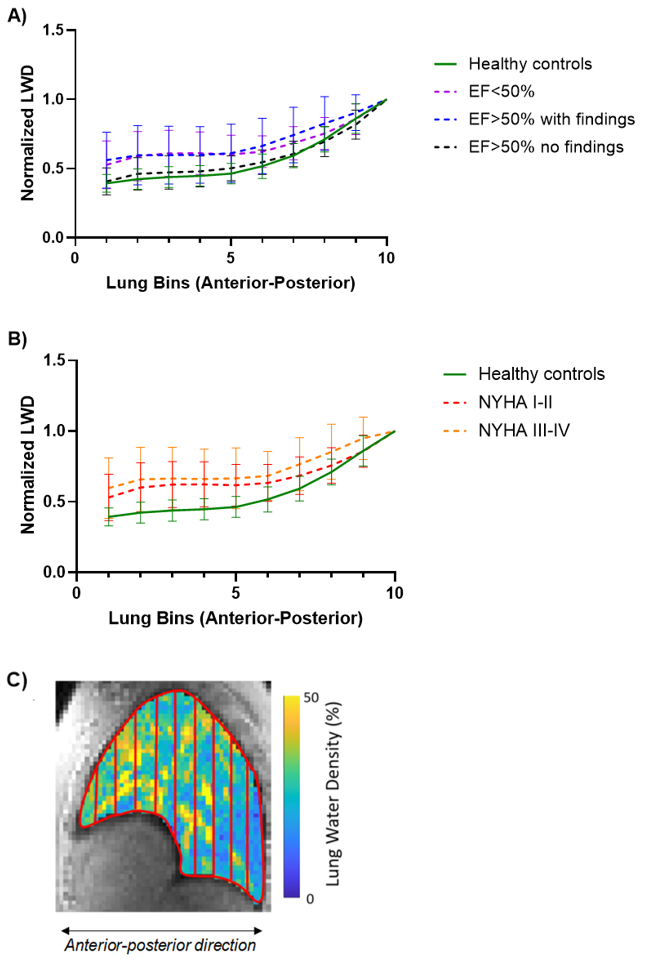
Global LWD was calculated as the average LWD from all lung voxels. Regional LWD was assessed in the anteroposterior direction, using 3 or 10 equally spaced bins (Fig 1 and Fig 3C). The average LWD was computed for each bin, and the anteroposterior LWD gradient was calculated from 3 bins as ΔLWDAP=(LWDposterior-LWDanterior)/LWDposterior. Additionally, we normalized each of 10 bins to the most posterior bin.
Results:
Figure 1 provides examples of lung water distribution for a healthy control and a patient. No differences in global LWD were detected between groups (Fig 2A,B). However, patients (both EF< 50% and EF >50%) had a lower anteroposterior gradient compared to controls (Fig 2C, DLWDAP = 31±17% vs 35±14% vs 47±8%, p< 0.05, respectively). Similarly, a significantly lower anteroposterior gradient was also observed in patients with diagnosed heart failure with NYHA classifications I-IV (Fig 2D). Dividing lung slices into 10 bins, we observed an exponential increase in lung water along the anteroposterior direction in all subjects except for 7 patients (Fig 3). Controls had a steeper curve compared to the patients with EF< 50% and EF >50% with a presence of heart disease.
Conclusion:
Patients with cardiac disease present with different anteroposterior lung water distribution compared to healthy controls, suggesting that 3D lung water imaging may provide important clinical information in the assessment and treatment of heart failure.
Figure 1. Sagittal images showing the lung divided into 3 equally sized bins in A) a healthy control and B) a patient with EF=71%. The control exhibits a higher lung water density (LWD) in the posterior regions compared to the anterior regions. In contrast, the patient demonstrates a higher LWD in the anterior vs posterior regions.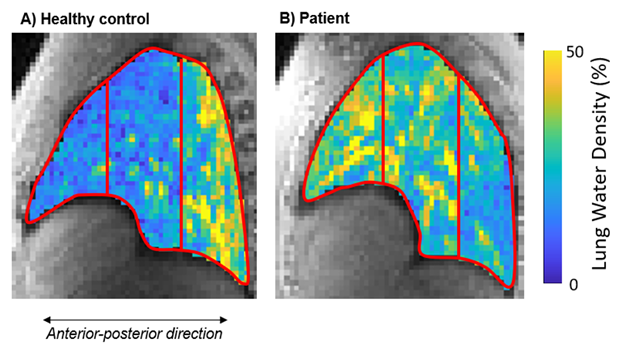
Figure 2. Global lung water density (LWD) and the anteroposterior gradient between healthy controls and patient groups. Global LWD did not differ between groups (A), neither between controls nor patients with heart failure (B). The regional anteroposterior LWD gradient differed between controls and patients with ejection fraction (EF)≤50%, and EF>50% with clinical findings (C), as well as between controls and patients with heart failure (D). The dashed purple line, set at 31%, represents the lower limit of a normal anteroposterior gradient, defined as the mean - 2 standard deviations (SD) from the healthy control group. *p < 0.05, **p < 0.01 (one-way ANOVA). 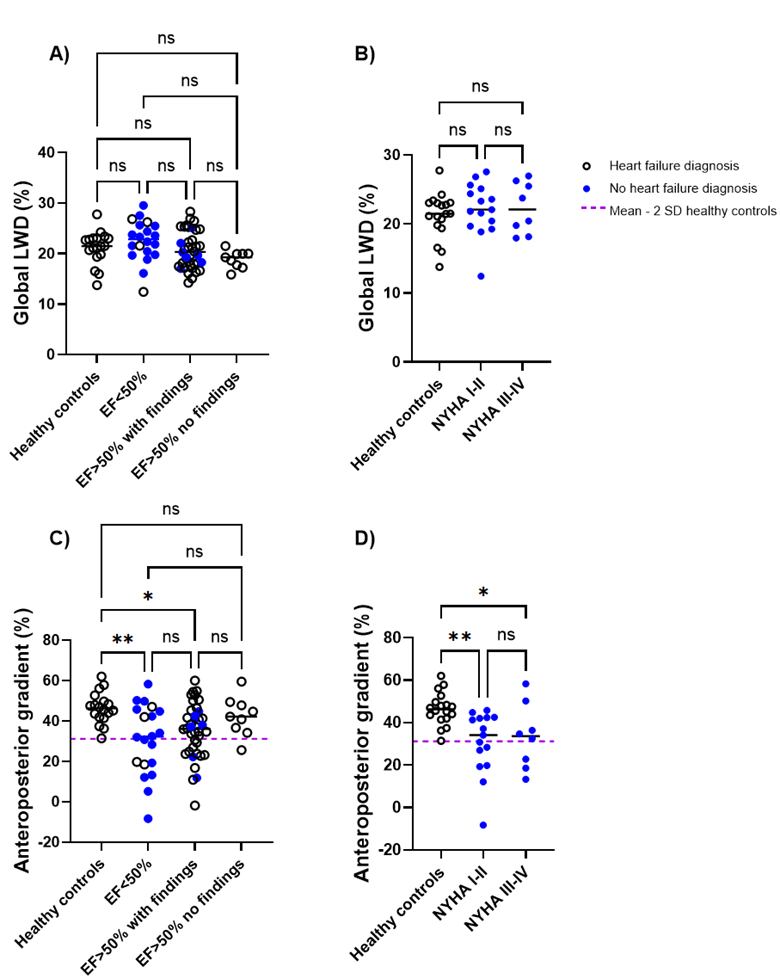
Figure 3. The regional lung water density (LWD) distribution was analyzed by computing the mean LWD in 10 anteroposterior sections, normalized to the most posterior bin. We illustrate the mean LWD curve across each group, with variability represented by error bars, which generally followed an exponential pattern. A) Patients with clinical findings had a flatter curve compared to controls and patients without findings, which is consistent with the observed anteroposterior gradient. B) Patients classified as NYHA III-IV had a slightly flatter mean curve compared to those in with NYHA I-II. C) Example of an LWD map divided into 10 equally sized bins in a patient with EF=71%.