Early Career
Thomas Skacel, BEng
MD/PhD Student
University of Virginia
Thomas Skacel, BEng
MD/PhD Student
University of Virginia
Nemati Saleh, N/A
Undergraduate Student
University of Virginia
Julia Bresticker, MS
MD/PhD Student
University of Virginia
Leigh Bradley
Lab Manager
University of Virginia
Caitlin Pavelec, PhD
Post Doctoral Fellow
University of Virginia
Matthew Wolf, MD, PhD
Associate Professor of Medicine
University of Virginia

Frederick H. Epstein, PhD
Professor
University of Virginia
University of Virginia
Heart failure with preserved ejection fraction (HFpEF) is a highly prevalent syndrome, yet current effective therapies are limited. HFpEF is increasingly understood as being comprised of varying phenogroups, of which, the cardiometabolic phenogroup, marked by obesity, metabolic dysfunction, and systemic inflammation, is particularly prevalent.1 Recent clinical trials have identified the glucagon-like peptide-1 receptor agonist (GLP-1RA) semaglutide (SEMA) as a likely therapy,2,3 though its physiological mechanisms of action remain incompletely understood. Our group has shown that mice fed a high-fat, high-sucrose (HFHS) diet for 18 weeks develop key features of the early stages of cardiometabolic HFpEF, including obesity, glucose intolerance, coronary microvascular dysfunction (CMD), and cardiac strain impairments.4 The aim of the present study was to investigate how SEMA influences these features in HFHS diet mice to help elucidate the underlying physiological mechanisms responsible for its therapeutic effects.
Methods:
C57BL/6J mice (n=11-12/group) were fed a HFHS diet (40% kcal fat, 40% kcal sucrose) for 18 weeks to induce obesity, glucose intolerance, CMD, and cardiac strain impairments. CMR was performed using a 9.4T small animal MRI system (Bruker) with a 35-mm diameter birdcage radiofrequency coil. The CMR protocol included mid-ventricular short axis (SA) rest and adenosine (600 µg/kg/min) stress perfusion CMR with a radial cine-arterial spin labeling (ASL) method,5 as well as DENSE to assess cardiac strain.6 Myocardial perfusion reserve (MPR) was calculated as the ratio of stress to rest myocardial blood flow (MBF). Peak circumferential strain (Ecc) and peak early diastolic strain rate (PEDSR) were calculated from DENSE measurements. Following baseline measurements (after 18 weeks of diet), mice were given one week to recover before receiving daily subcutaneous injections of SEMA (9 nmol/kg/day) or vehicle (PBS) for 28 days. Post-treatment CMR was conducted to evaluate the effects of treatment. Statistical analysis was performed using repeated measures two-way ANOVA with Sidak’s multiple comparisons test.
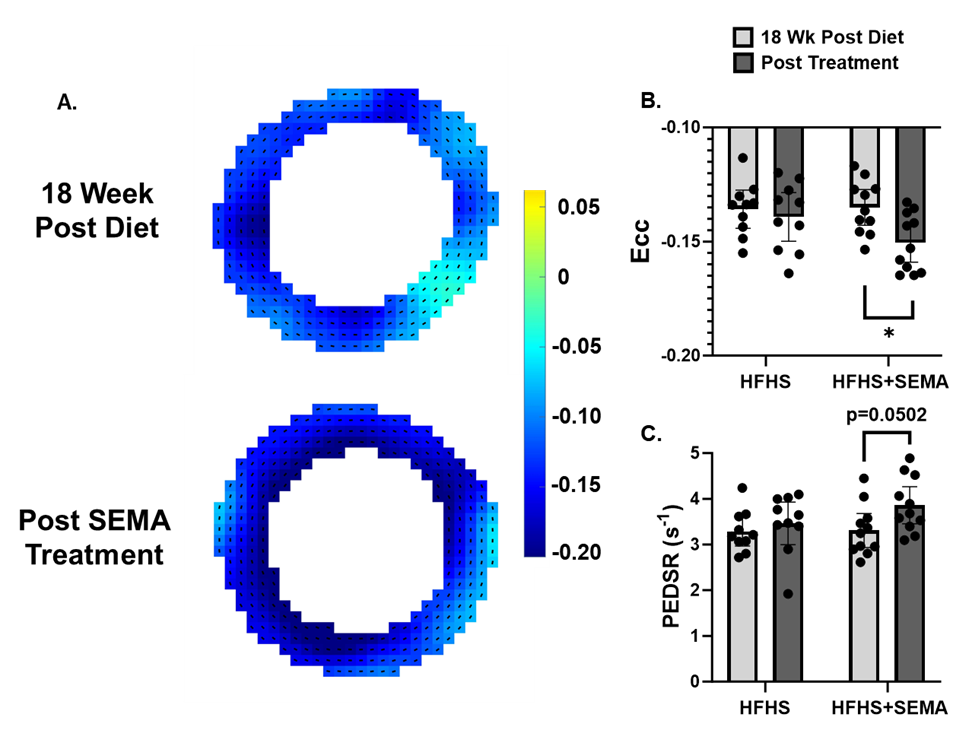
Results: SEMA significantly reduced body weight and glucose intolerance compared to HFHS controls (Fig. 1). SEMA reversed impairments in MPR compared to 18 weeks post diet (MPR 1.99 ± 0.44 vs. 1.57 ± 0.34; p = 0.015) (Fig. 2) and compared to HFHS mice at the post treatment timepoint (MPR 1.99 ± 0.44 vs. MPR 1.39 ± 0.29; p = 0.0005). SEMA also improved systolic strain (Ecc -0.151 ± 0.013 vs. -0.135 ± 0.012; p = 0.01) (Fig. 3), with a trend towards significant improvements in diastolic strain rate in the SEMA group (PEDSR 3.86 ± 0.60 vs. 3.31 ± 0.56 s-1; p=0.0502). Data written as mean ± SD.
Conclusion:
SEMA reversed impairments in MPR, strain and PEDSR in HFHS diet mice. These findings contribute to our understanding of the mechanisms by which SEMA acts to improve cardiac function in cardiometabolic HFpEF.
Supported by NIH R01HL162872 and T32GM007267.
Figure 1: A) Timeline of mouse experiments. B) Mouse weights were recorded daily during the treatment period beginning two days prior to treatment. C) Average glucose tolerance curves for HFHS and HFHS+SEMA mice at 18 weeks post diet and post treatment. D) Glucose tolerance test (GTT) area-under-curve (AUC) measurements. *P <0.05; $P <0.01; # or ****P <0.0001 for indicated groups. +P <0.001 for HFHS+SEMA – Post Treatment vs. other groups. Data are presented as mean ± 95% confidence intervals (CI).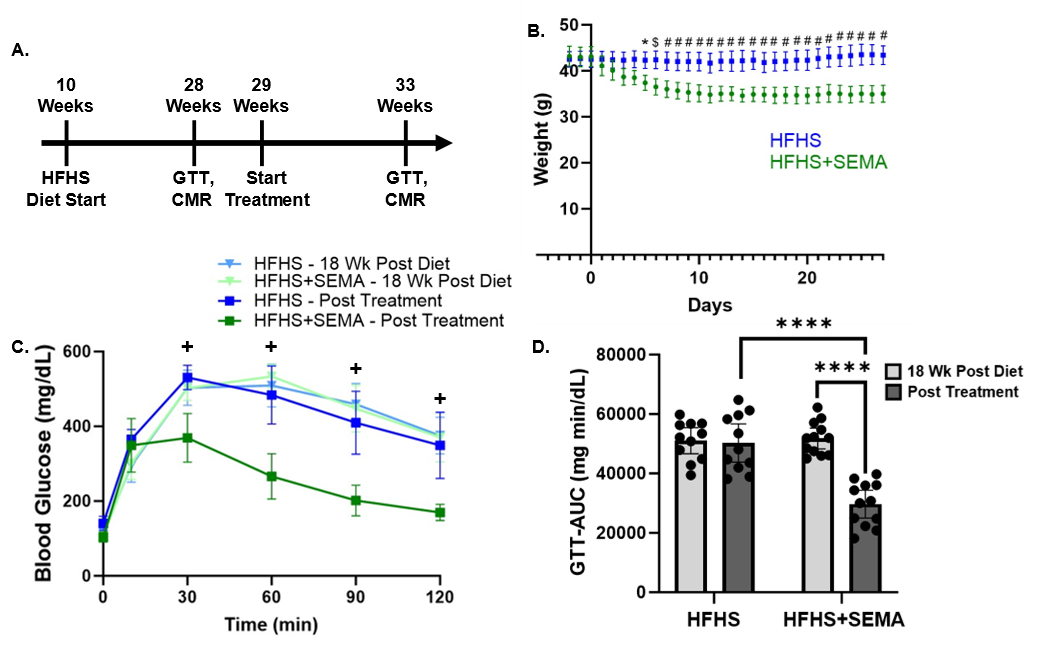
Figure 2: A) Example rest and adenosine stress perfusion maps overlayed on tag contrast ASL images. B) MPR computed as a ratio of stress to rest MBF. Data are presented as mean ± 95% CI. *P <0.05; ***P <0.001 for indicated groups..png)
Figure 3: A) Example circumferential strain maps from a mouse before and after SEMA treatment. B) Peak Ecc and C) PEDSR were calculated with DENSE analysis. Data are presented as mean ± 95% CI. *P <0.05 for indicated groups.