Clinical & Translation
John T. Echols
PhD Candidate
University of Virginia
John T. Echols
PhD Candidate
University of Virginia
Shuo Wang, MD, PhD
Research Associate
University of Virginia Health System
Jamey Cutts, MD
Cardiology Fellow
University of Virginia Medical center

Amit R. Patel, MD
Professor of Medicine
Division of Cardiology, University of Virginia Health System, Charlottesville, Virginia, USA.

Frederick H. Epstein, PhD
Professor
University of Virginia
University of Virginia
Epicardial adipose tissue (EAT) is cardioprotective under healthy conditions, but in obesity and metabolic syndrome it becomes proinflammatory. Facilitated by the secretion of cytokines into a shared microcirculation, proinflammatory EAT acts as a transducer of metabolic inflammation to the myocardium and coronary vessels1. The fatty acid composition (FAC) of EAT, particularly saturated fatty acids, are a driver of this process2,3. Our recent work introduced the first FAC MRI method for EAT imaging in humans4 and the present work investigates EAT FAC imaging in the context of heart failure with preserved ejection fraction (HFpEF).
Methods:
EAT FAC chemical-shift-encoded images were acquired using a breath-hold, ECG-gated radial rate-6 undersampled multi-echo gradient-echo sequence with a local low rank reconstruction and a variable projection mapping method based on a 9-resonance triglyceride model5. The imaging protocol is described in Figure 1D. Sixteen echoes with initial TE of 2.2ms and echo spacing of 2.4ms were acquired in 12 heartbeats. FAC mapping quantified the fractions of saturated (SFA), monounsaturated (MUFA) and polyunsaturated fatty acids (SFA). Studies were performed at 1.5T (Aera, Siemens). Method validation utilized a phantom containing seven oils of varying compositions submerged in a water bath, with reference FAC values measured by NMR spectroscopy.
We recruited 26 patients who had a recent transthoracic echocardiogram (TTE) and were scheduled for a clinical CMR examination. EAT was manually segmented and the mean EAT FAC was calculated. EAT volume index (EATVi) was quantified through manual segmentation of end-systolic short-axis cine images and indexed using body surface area. For all subjects, the severity of left ventricular diastolic dysfunction (LVDD) was determined by two clinicians using TTE. Additionally, the H2FPEF score6 was calculated and used to determine likelihood of HFpEF, with scores of 6 to 9 indicating a high probability of HFpEF.
Results:
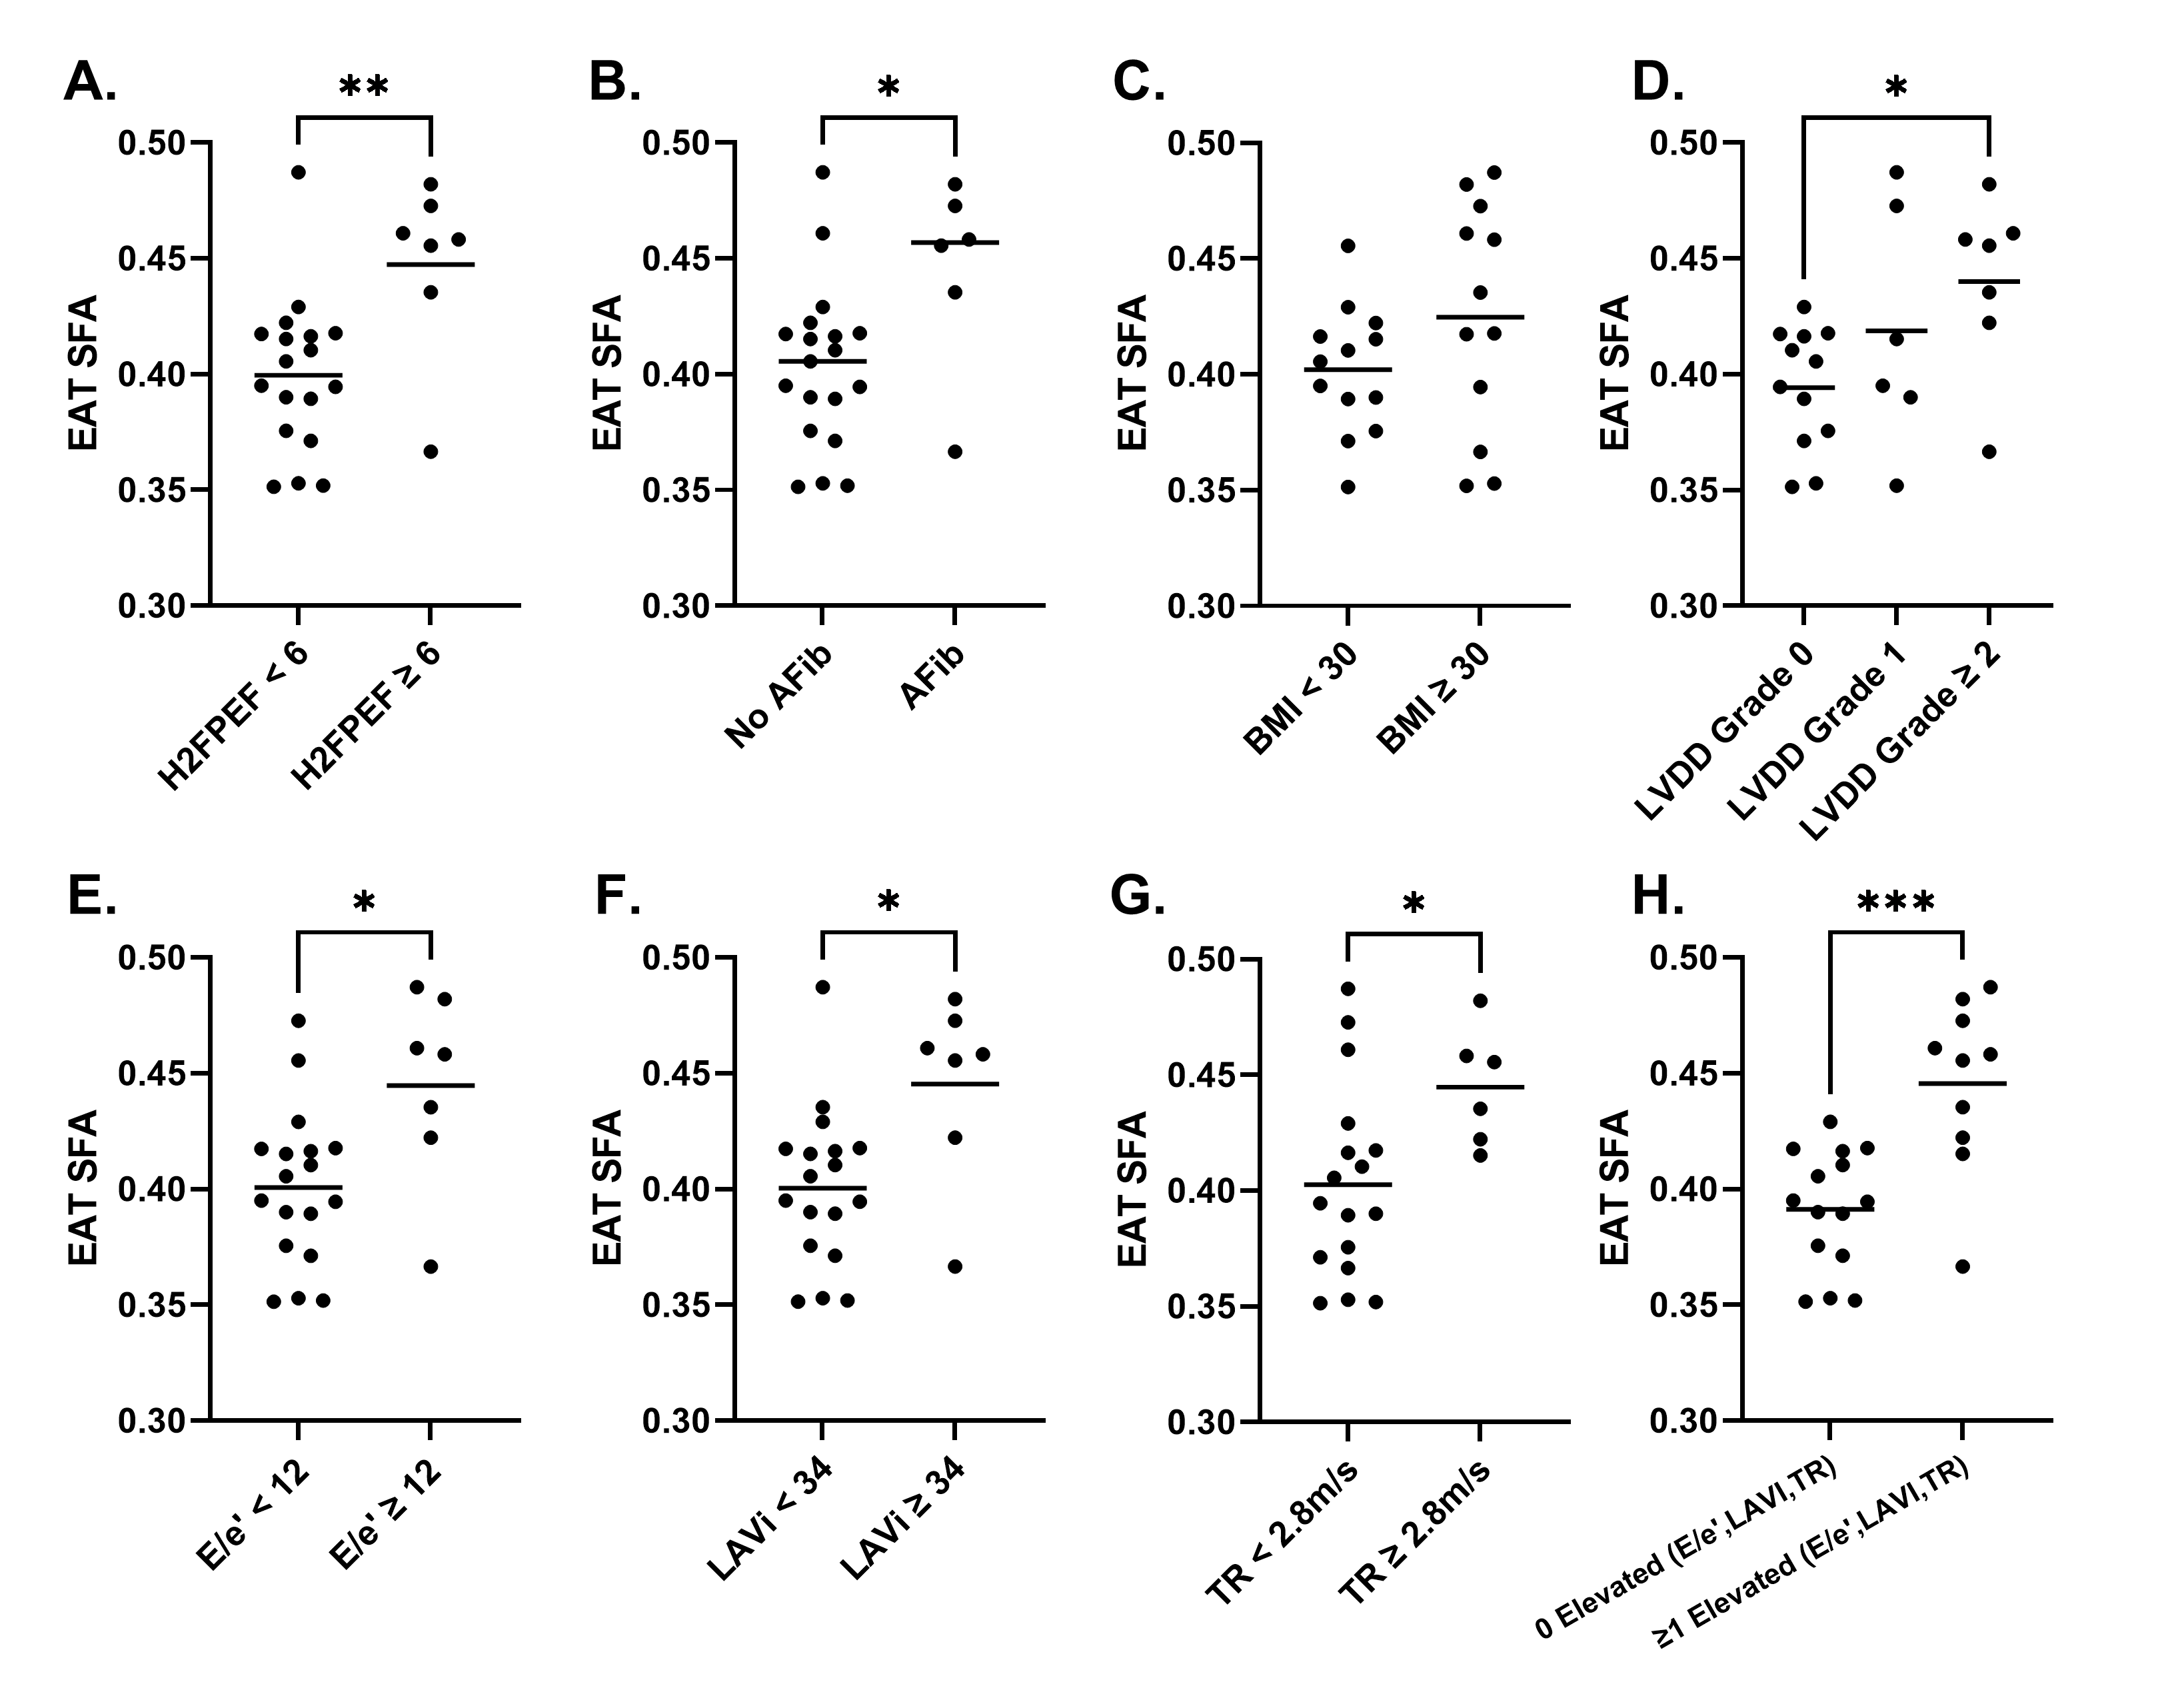
Oil phantom validation results show strong (r >0.98) and significant (p< 0.0001) correlations between measured and reference FAC values (Figure 1). Figure 2A describes demographic information for the cohort. Example FAC images/maps from a HFpEF patient are shown in Figure 2B. Figure 3 shows that EAT SFA fraction is significantly elevated in patients with a high H2FPEF score and in those with its key component, the presence of atrial fibrillation. SFA fraction was also significantly elevated in patients with grade II and III LVDD, and in the underlying parameters used to grade diastolic dysfunction (E/e’≥12, left atrial volume index (LAVi)≥34ml/m2, and tricuspid regurgitation velocity (TR)≥2.8m/s). SFA was not different between obese and non-obese individuals. EATVi was also elevated in patients with grade 2 and 3 LVDD (p=0.01), elevated E/e’(p=0.02), and elevated TR velocity (p=0.04), but not elevated for the other comparisons shown in Figure 3.
Conclusion:
This report shows, for the first time, that elevated EAT SFA is associated with features of HFpEF, including the H2FPEF score and the severity of diastolic dysfunction. The differences were more pronounced than those seen with EATVi, suggesting that EAT FAC may be more strongly associated than EATVi with HFpEF.
This work was supported by AHA 23PRE1011202, NIH R01HL162872 and NIH T32 HL007284.
Figure 1. (A) Synthetic FAC maps of the oil phantom made using reference NMR values. (B) MRI measured FAC maps of the oil phantom. (C) Scatter plots depicting agreement between the mean FAC of each oil and the reference NMR values. Pearson correlation coefficient r and the associated p-value are reported for each measurement. Red line indicates line of identity. (D) Imaging Protocol for EAT FAC MRI.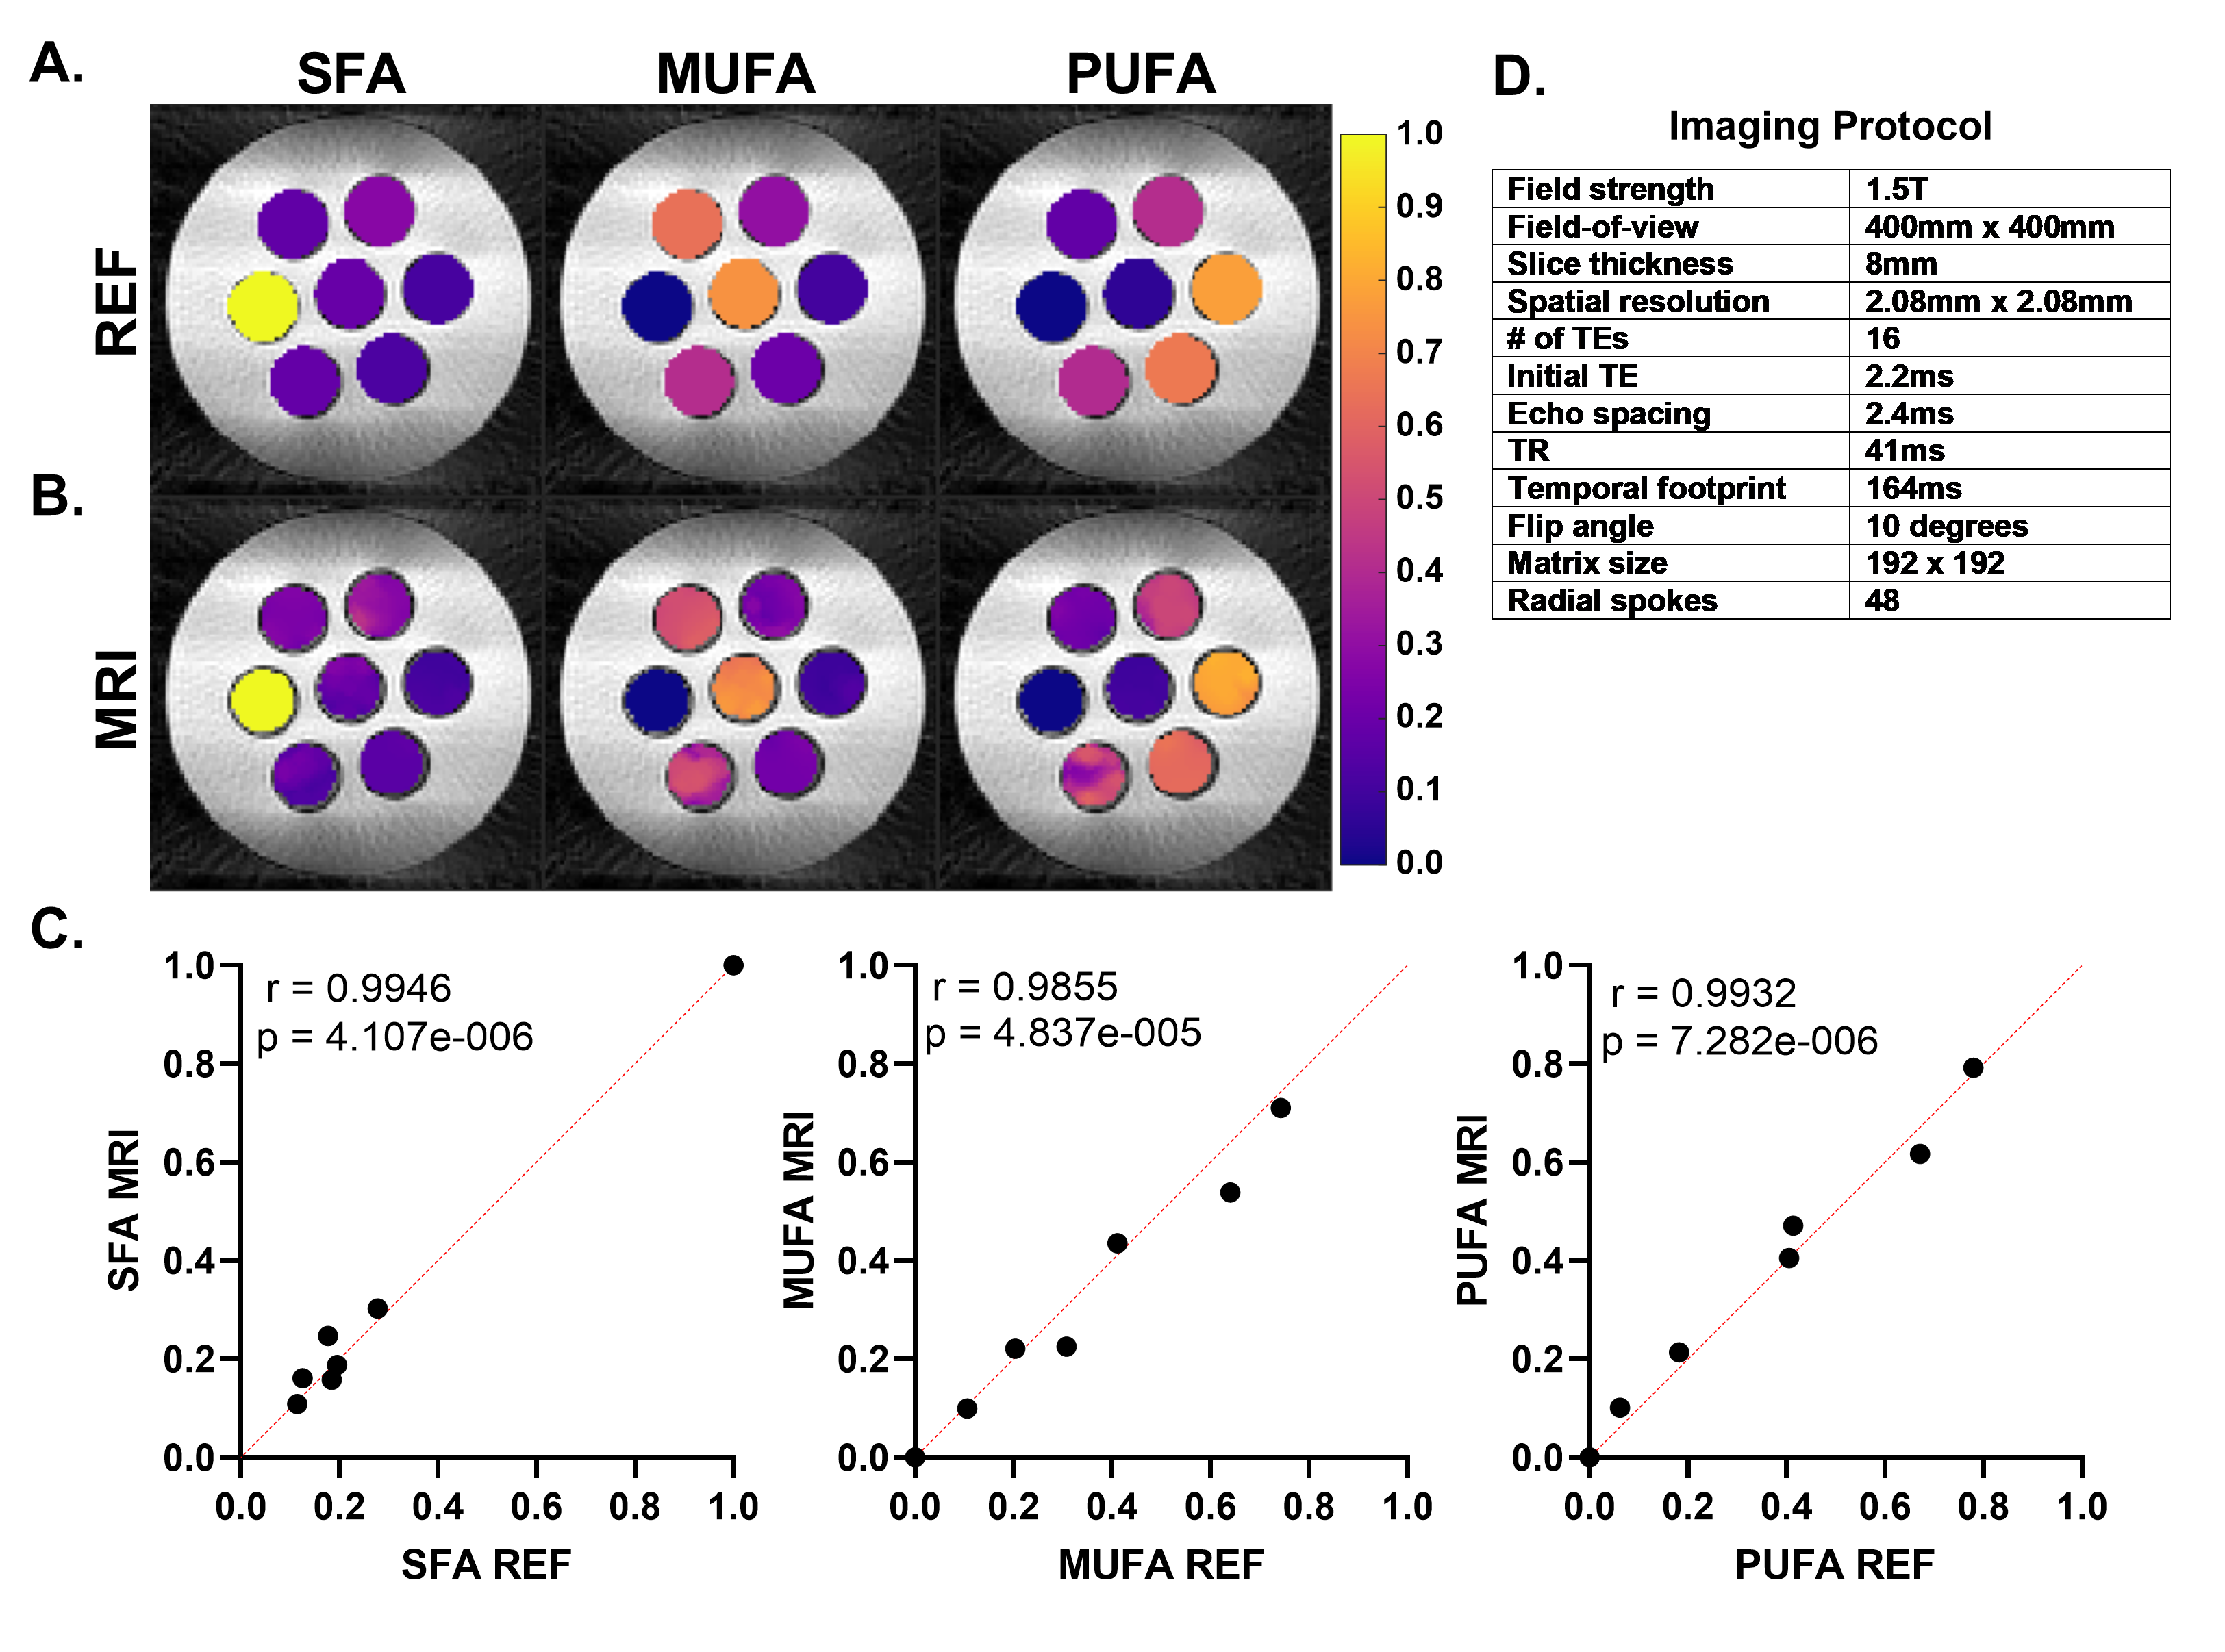
Figure 2. (A) Population demographics for the studied cohort. (B) EAT FAC images and maps from a four-chamber and apical short-axis slice in a representative HFpEF patient. Shown are the magnitude images at the first TE and the overlayed maps of SFA, MUFA, and PUFA for the EAT.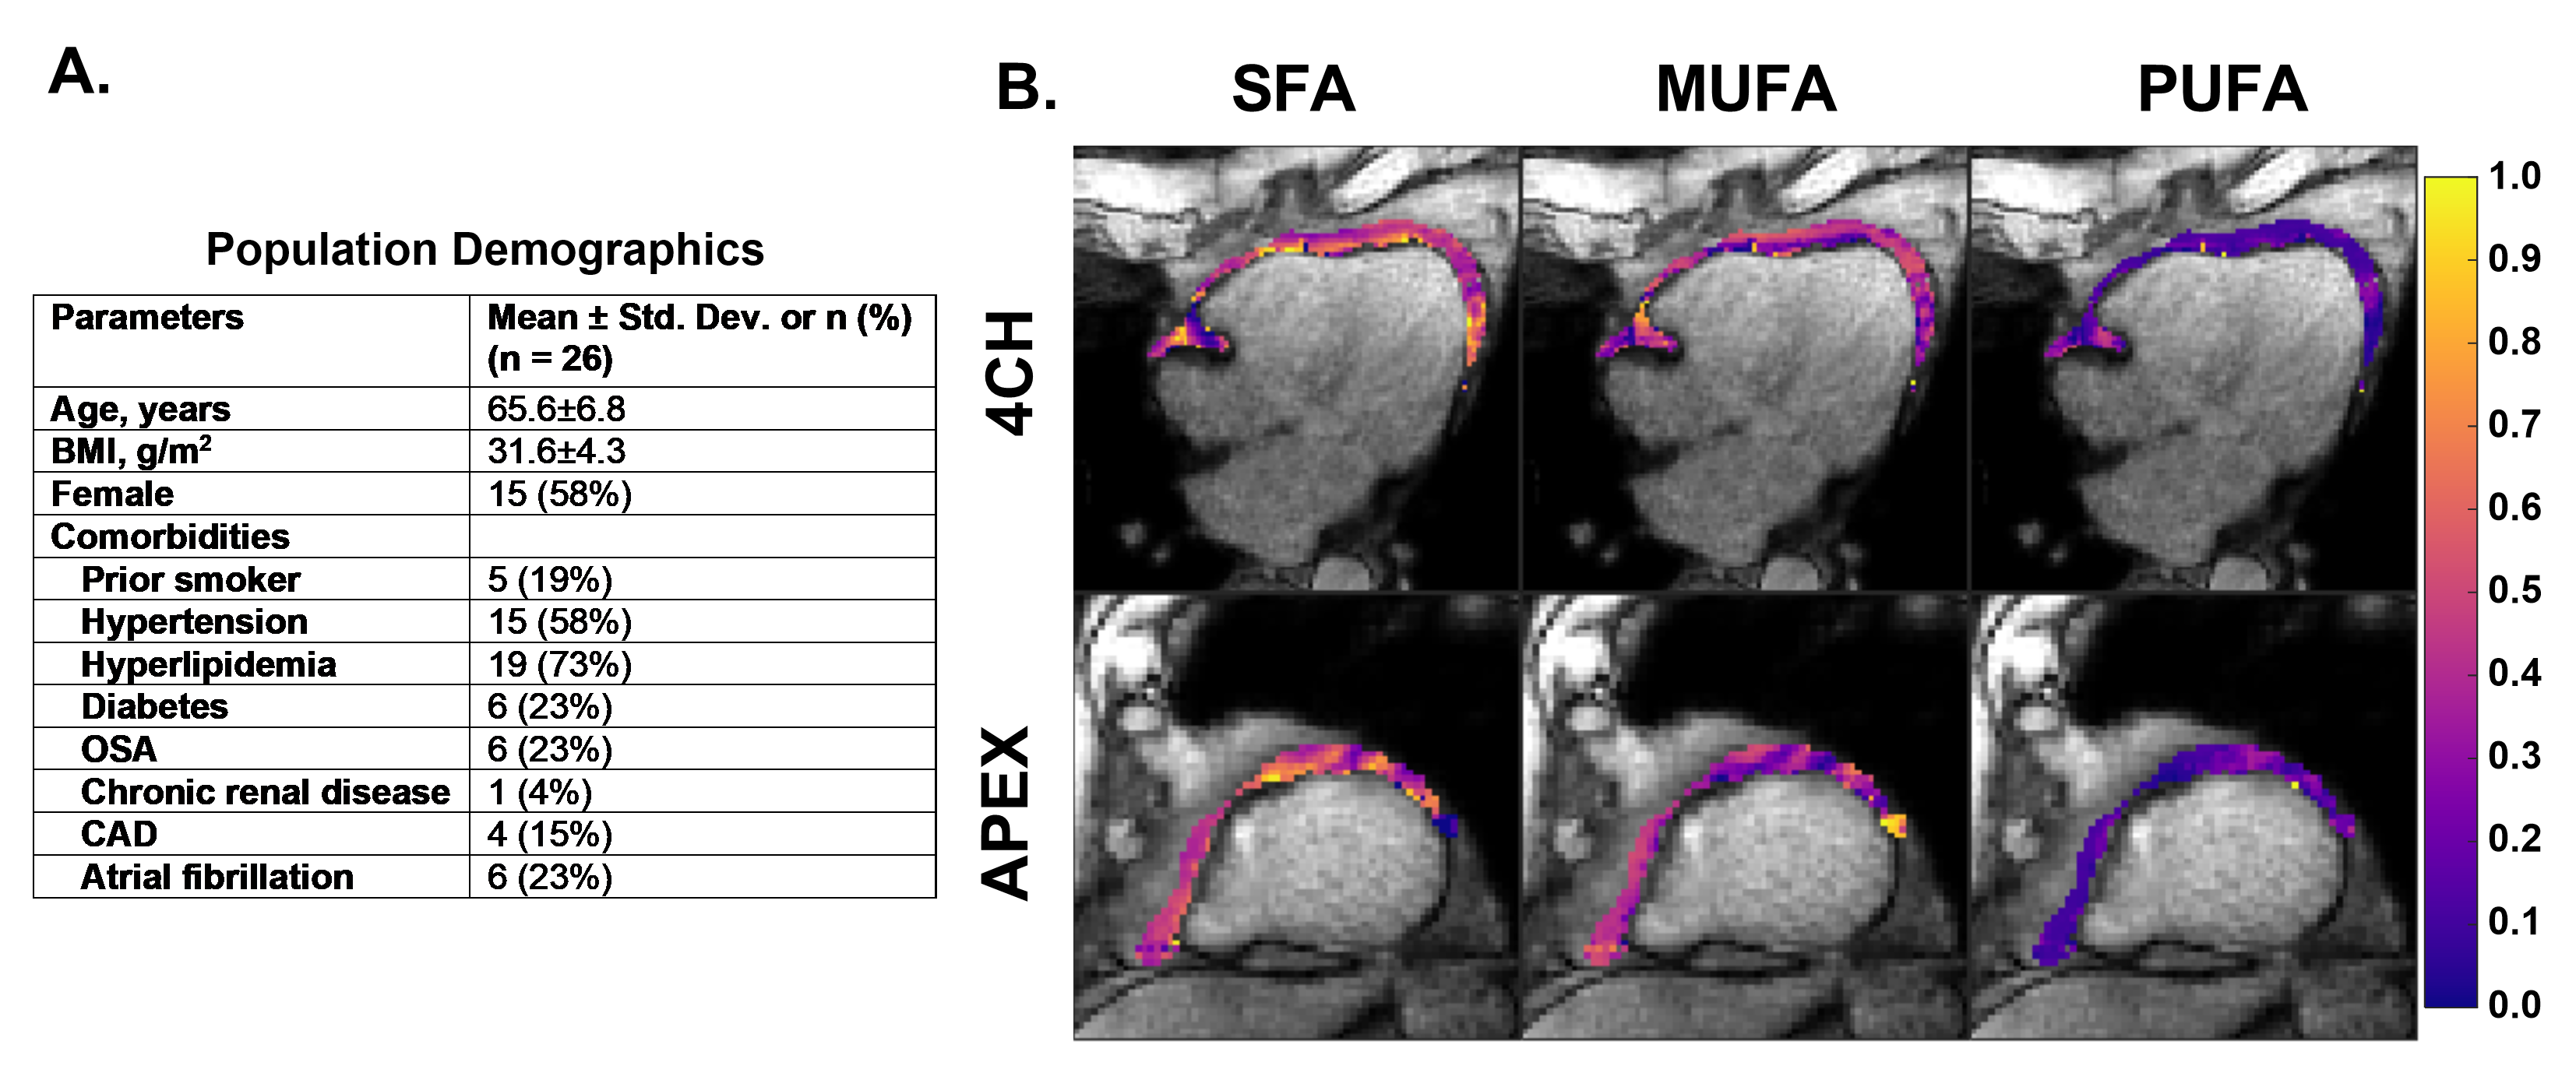
Figure 3. Comparisons of EAT SFA between groups of patients with/without: (A) a H2FpEF score of 6 or higher; (B) a history of atrial fibrillation; (C) a BMI of 30 or higher; (D) a LVDD grade of 0, 1, 2 or higher; (E) E/e’ of 12 or higher; (F) LAVI of 34 or higher; (G) TR velocity of 2.8m/s or higher; (H) at least 1 elevated measurement of E/e’, LAVI, or TR velocity. *p < 0.05; **p < 0.01; ***p < 0.001;