Quick Fire Cases
Varun Bhasin, MD
Advanced Cardiac Imaging Fellow
Hospital of the University of Pennsylvania
Varun Bhasin, MD
Advanced Cardiac Imaging Fellow
Hospital of the University of Pennsylvania

Harold I. Litt, MD, PhD
Division Chief, Cardiothoracic Imaging
Hospital of the University of Pennsylvania
Maria Cecilia Ziadi, MD
Clinical Assistant Professor of Radiology
Hospital of the University of Pennsylvania
Monika Sanghavi, MD
Associate Professor
Hospital of the University of Pennsylvania
Mahesh K. Vidula, MD
Assistant Professor of Cardiovascular Medicine
Hospital of the University of Pennsylvania
A 74-year-old woman with a history of hypertension, hyperlipidemia, type 2 diabetes, and obesity presented with chest tightness a few days after a mechanical fall. She was found to have an elevated high-sensitivity troponin, and the ECG demonstrated ST segment elevations in the anterolateral leads. Contrast echocardiogram revealed normal left ventricular (LV) wall thickness and systolic function, with a normal LV ejection fraction and mild hypokinesis of the apical wall segments. Due to the ECG, echo findings, and elevated troponin, there was concern for ongoing ischemia in the left anterior descending artery (LAD) territory. Subsequent coronary angiography did not reveal any obstructive coronary disease, and her presentation was felt to be consistent with myocardial infarction with non-obstructive coronary arteries (MINOCA). CMR was completed 3 weeks after the index hospitalization and revealed LV hypertrophy of the mid to apical septum, elevated native T1 and T2 values, and nonischemic late gadolinium enhancement (LGE). Repeat CMR 4 months later showed improvement in the LV apical hypertrophy and normalization of native T1 and T2 values. Overall, her presentation was felt to be due to stress cardiomyopathy.
Diagnostic Techniques and Their Most Important Findings:
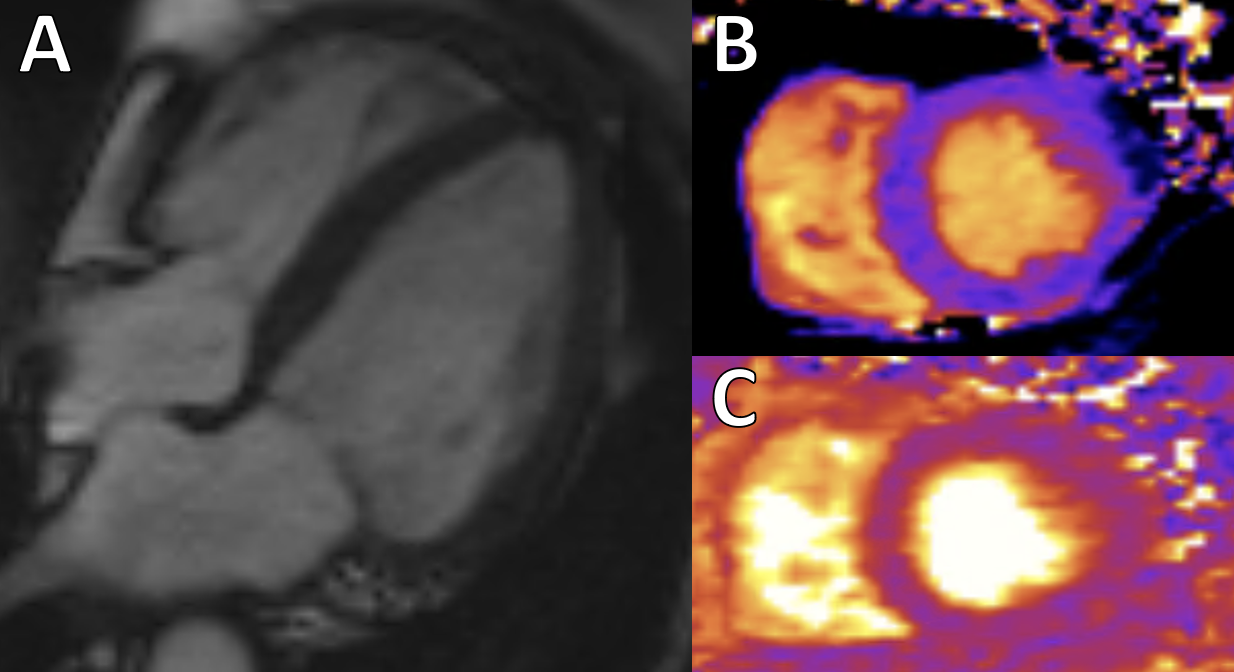
Cardiac MRI (CMR) obtained 3 weeks after the index hospitalization revealed a normal LV ejection fraction of 58%, along with LV hypertrophy of the mid to apical septum (Figure 1A). This hypertrophy, resembling apical hypertrophic cardiomyopathy (HCM), was not observed on the previous echocardiogram. The apical wall motion was normal and improved compared to the prior echocardiogram. There was elevation in native T1 (Figure 1B) and T2 (Figure 1C) values in the mid to apical segments, and faint, patchy LGE involving the mid to apical segments (Figure 2).
Repeat CMR 4 months later demonstrated a reduction in apical wall thickness (Figure 3A), and interval normalization of both myocardial T1 and T2 times (Figure 3B and 3C) in the mid to apical septum. These findings suggested that the increased wall thickness seen on the prior study was likely due to edema associated with stress cardiomyopathy.
Learning Points from this Case:
Cardiac MRI is a valuable tool for the diagnosis of stress cardiomyopathy. In patients with stress cardiomyopathy, elevated native T1/T2 values can be seen in the affected territories due to edema. Patients typically do not have significant delayed enhancement, but some can have patchy, diffuse LGE in the affected segments. Some can also have a focal, transmural area of LGE at the hinge point between the hyperkinetic and akinetic myocardium. Apical hypertrophy has been noted in some patients imaged 3-4 weeks following the acute event, possibly due to edema in the affected segments, with resolution of the apical hypertrophy after a few months. Further investigation is required to better understand the mechanism of this reversible hypertrophy.
Figure 1: A. 4-Chamber steady-state free precession (SSFP) cine sequence revealing hypertrophy of the mid to apical septum; B. Pre-Contrast T1 Map demonstrating elevated T1 time of 1200 ms at the mid septum; C. T2 Map demonstrating elevated T2 time of 55 ms at the mid septum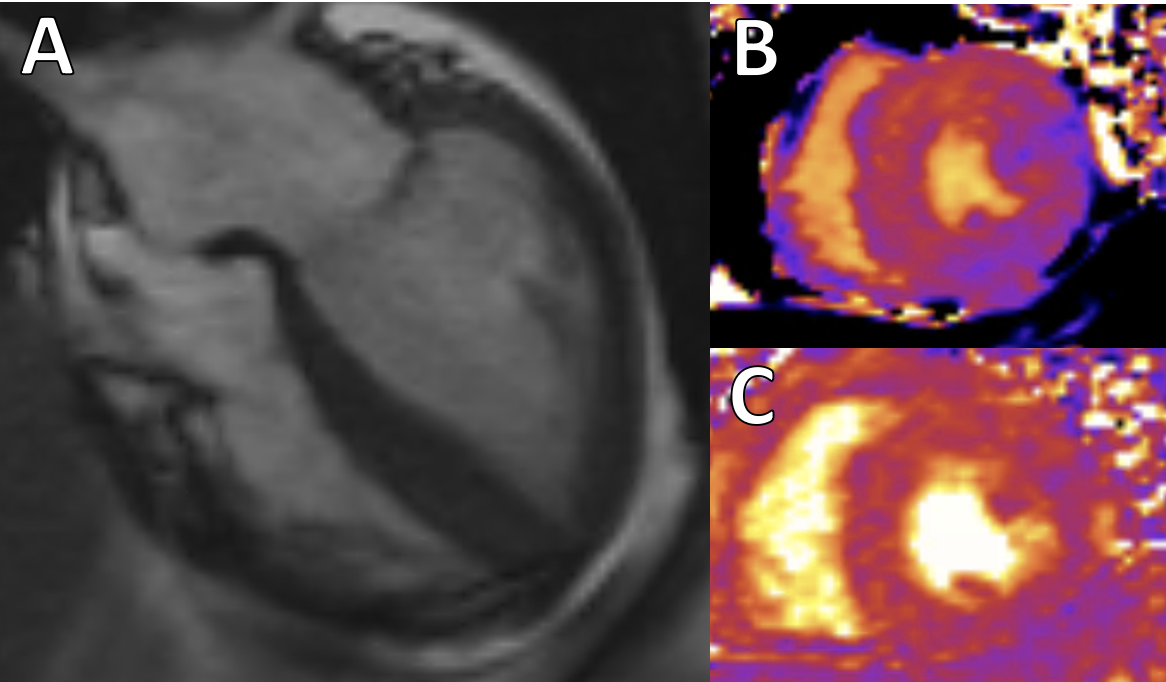
Figure 2: Phase Sensitive Inversion Recovery (PSIR) LGE image revealing patchy late gadolinium enhancement involving the mid to apical segments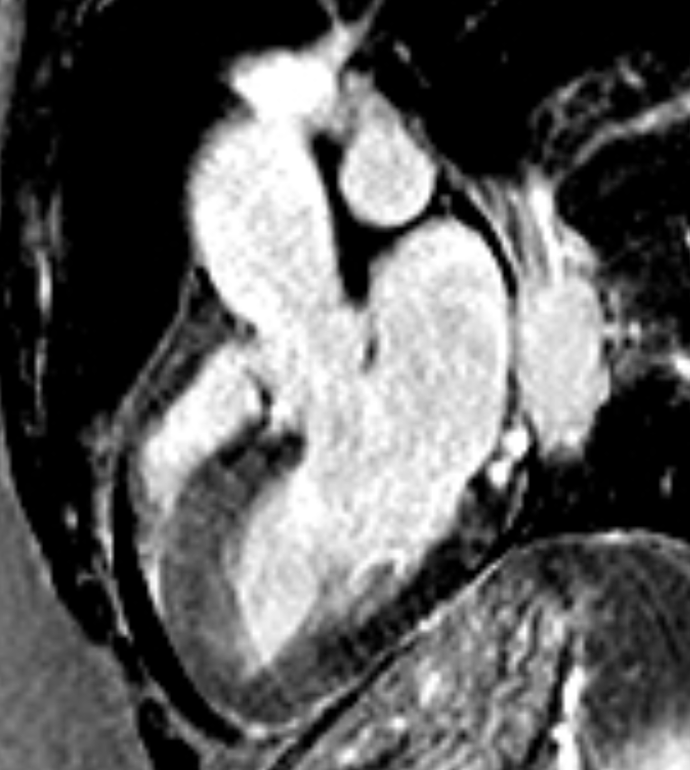
Figure 3: A. 4-Chamber steady-state free precession (SSFP) cine sequence from the repeat cardiac MRI completed 4 months later showing interval reduction in apical wall thickness; B. Pre-contrast T1 map demonstrating a normal T1 time of 968 ms at the mid septum; C. T2 map demonstrating a normal T2 time of 44 ms at the mid septum