ISMRM - SCMR Workshop

Tyler E. Cork, MSc
PhD Candidate
Stanford University
Tyler E. Cork, MSc
PhD Candidate
Stanford University
Ariel J. Hannum, MSc
PhD Candidate
Stanford University
Michael Loecher, PhD
Research Scientist
Stanford University

Daniel B. Ennis, PhD
Professor
Stanford University
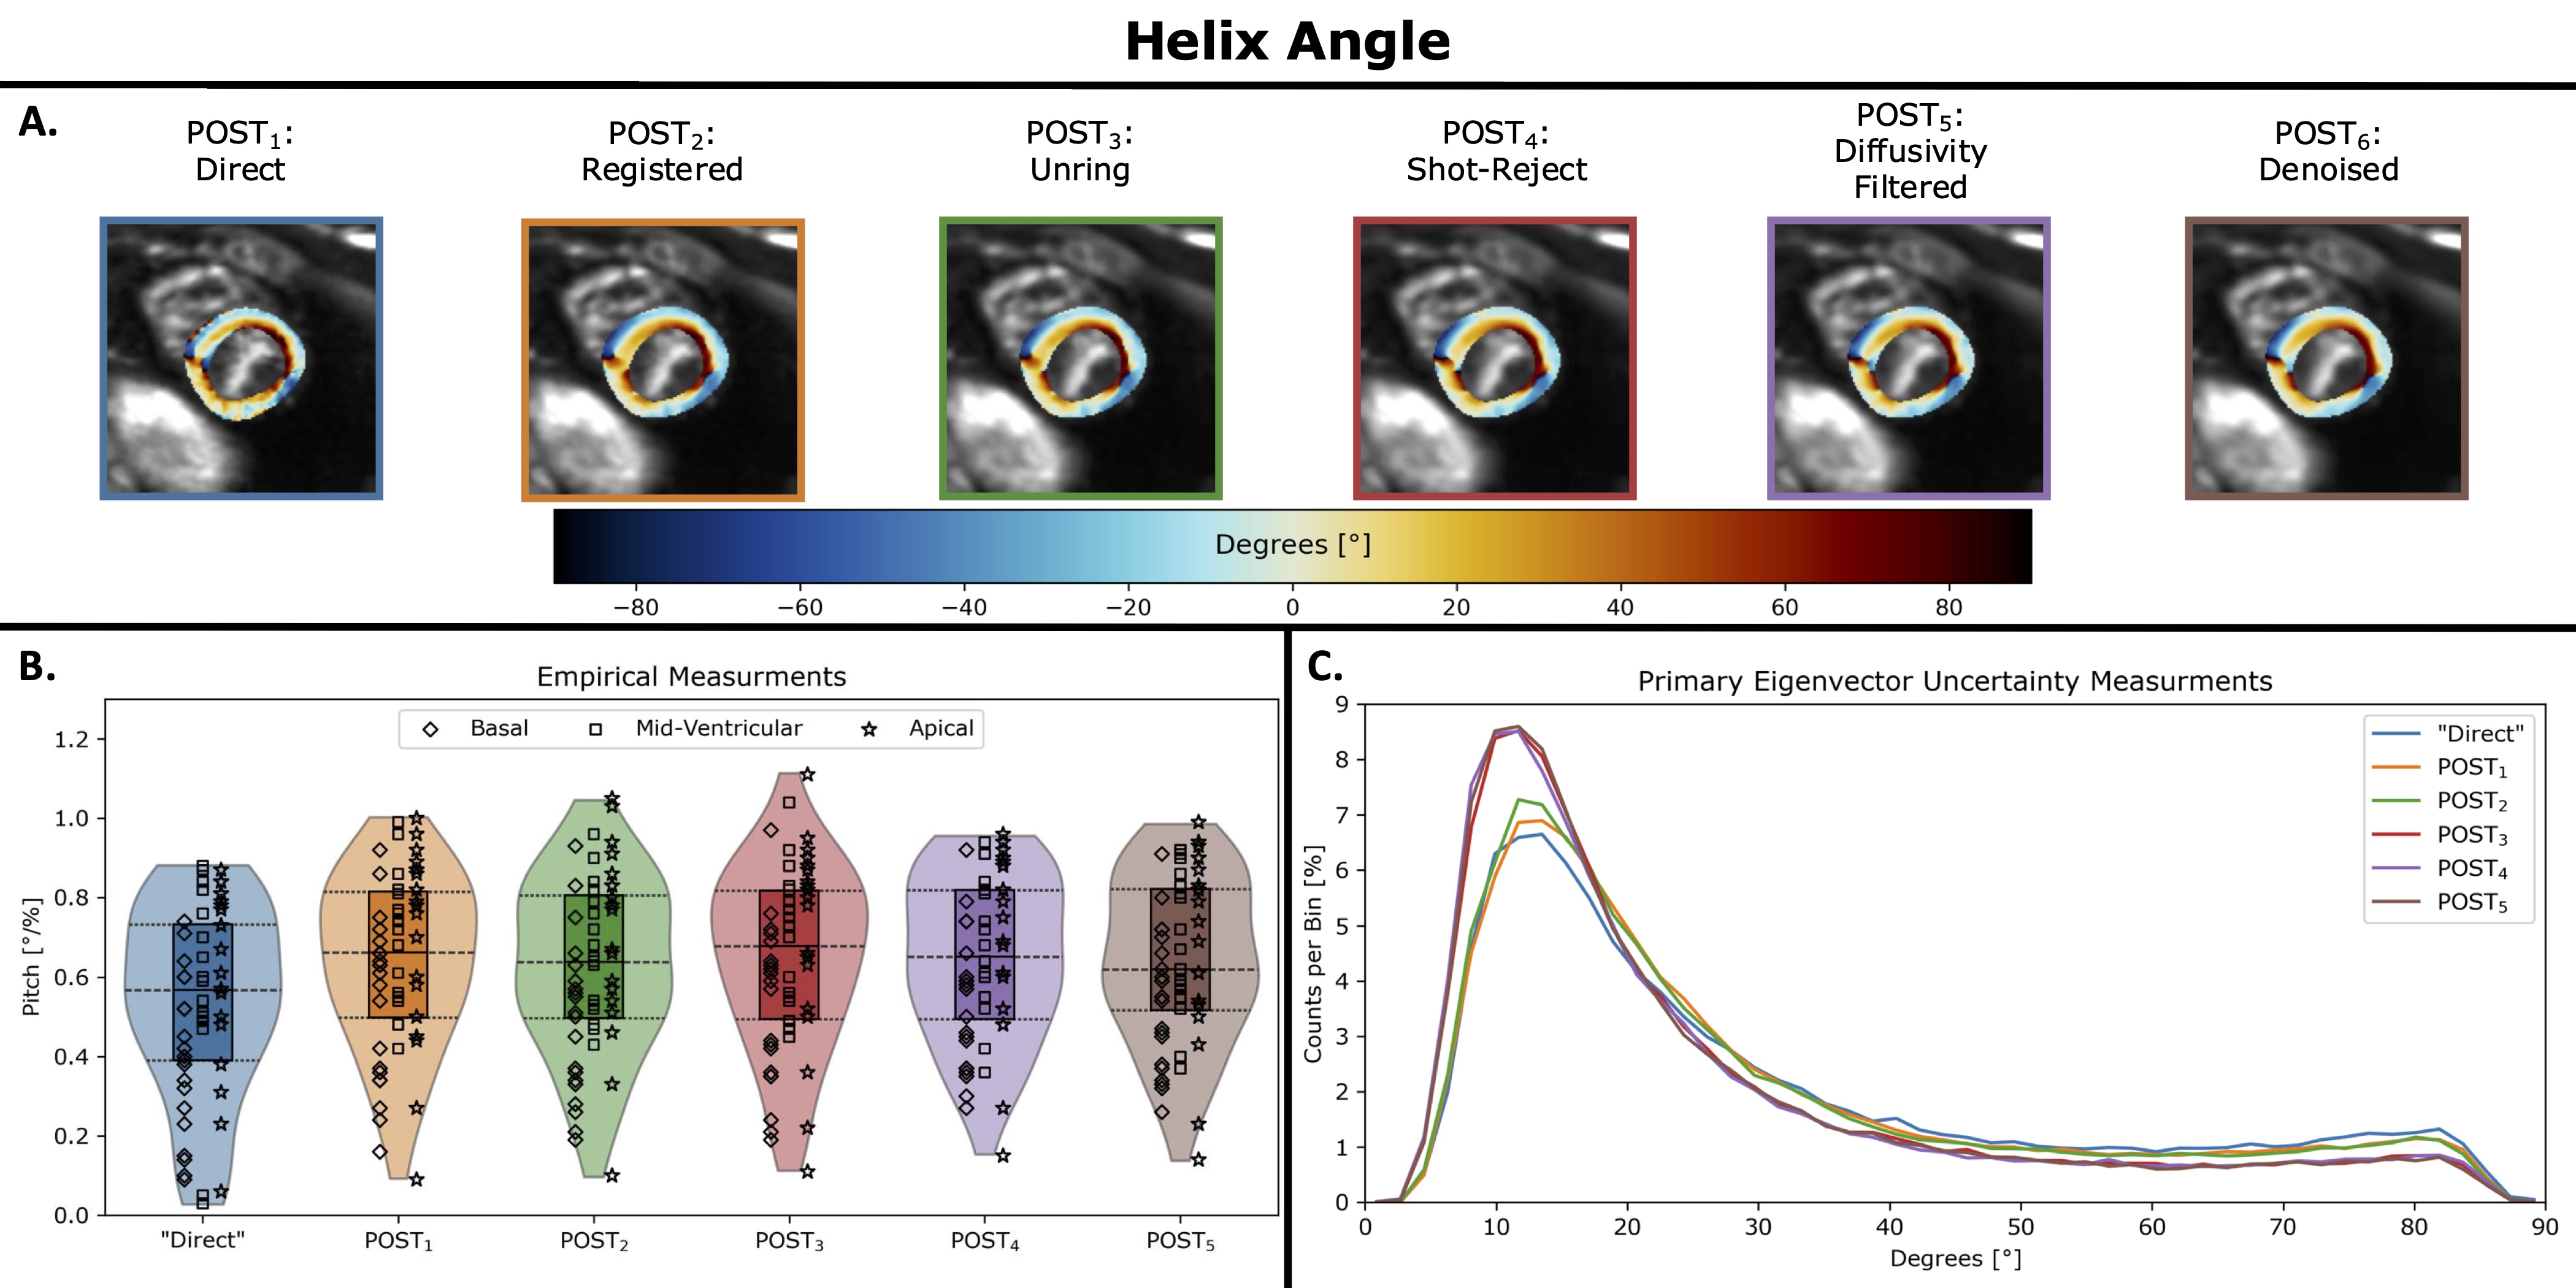
Median MD (µm2/ms) was consistent (“Direct”=1.55, POST1=1.58, POST2=1.58, POST3=1.57, POST4=1.54, POST5=1.54). The largest percent change (2.6%) was between POST1 (Registration) and POST5 (Denoise). Maximum likelihood (MLH) of dMD (µm2/ms) generally decreased across all POSTs (“Direct”=0.36, POST1=0.33, POST2=0.30, POST3=0.27, POST4=0.24, POST5=0.27). Median FA (unitless) decreased across all POSTs (“Direct”=0.35, POST1=0.32, POST2=0.32, POST3=0.31, POST4=0.30, POST5=0.29). The largest percent change (19.2%) occurred between “Direct” and POST5 (Denoise). MLH of dFA (unitless) generally decreased across all POSTs (“Direct”=0.17, POST1=0.16, POST2=0.14, POST3=0.13, POST4=0.11, POST5=0.12). Median HAP (°/%) was generally steepened compared to “Direct” (“Direct”=0.57, POST1=0.66, POST2=0.64, POST3=0.68, POST4=0.67, POST5=0.62). The largest percent change (19.5%) was observed between “Direct” and POST3 (Shot-Reject). The MLH of de1 (°) was consistent (“Direct”=13, POST1=11, POST2=11, POST3=10, POST4=11, POST5=11).
Conclusion:
cDTI data processing with CarDpy generally improves cDTI metrics, suggesting less motion corruption, better image registration, and lower noise. The CarDpy pipeline also typically decreased the maximum likelihood for each estimated metric, indicating that the data is more self-consistent. After evaluation, the shot-reject step (POST4) appears to have the biggest impact on improving these metrics, while the other POSTs contribute less to improving cDTI metric quality. This study demonstrated the importance of data processing steps for cDTI and the impact on the cDTI metrics.
Funding: R01 HL152256 and NSF 2205103.
Figure 1A: Qualitative images displaying mean diffusivity (MD) for a single volunteer at a left ventricular (LV) basal slice for each post-processing step (POST). Figure 1B: Median MD values for all LV slices across all volunteers. The median values of MD across POSTs remained stable with a maximum percent change of 2.6% when comparing POST1 (Registered) to POST5 (Denoised). Figure 1C: Uncertainty measurements of MD (assessed for all LV voxels and for all slice across all volunteers) showed a general trend of decreased maximum likelihood from “Direct” to POST3 (Shot-Reject). POST4 (Diffusivity Filtered) displayed the lowest overall uncertainty for MD, while POST5 (Denoised) displayed similar results as POST3 (Shot-Reject). 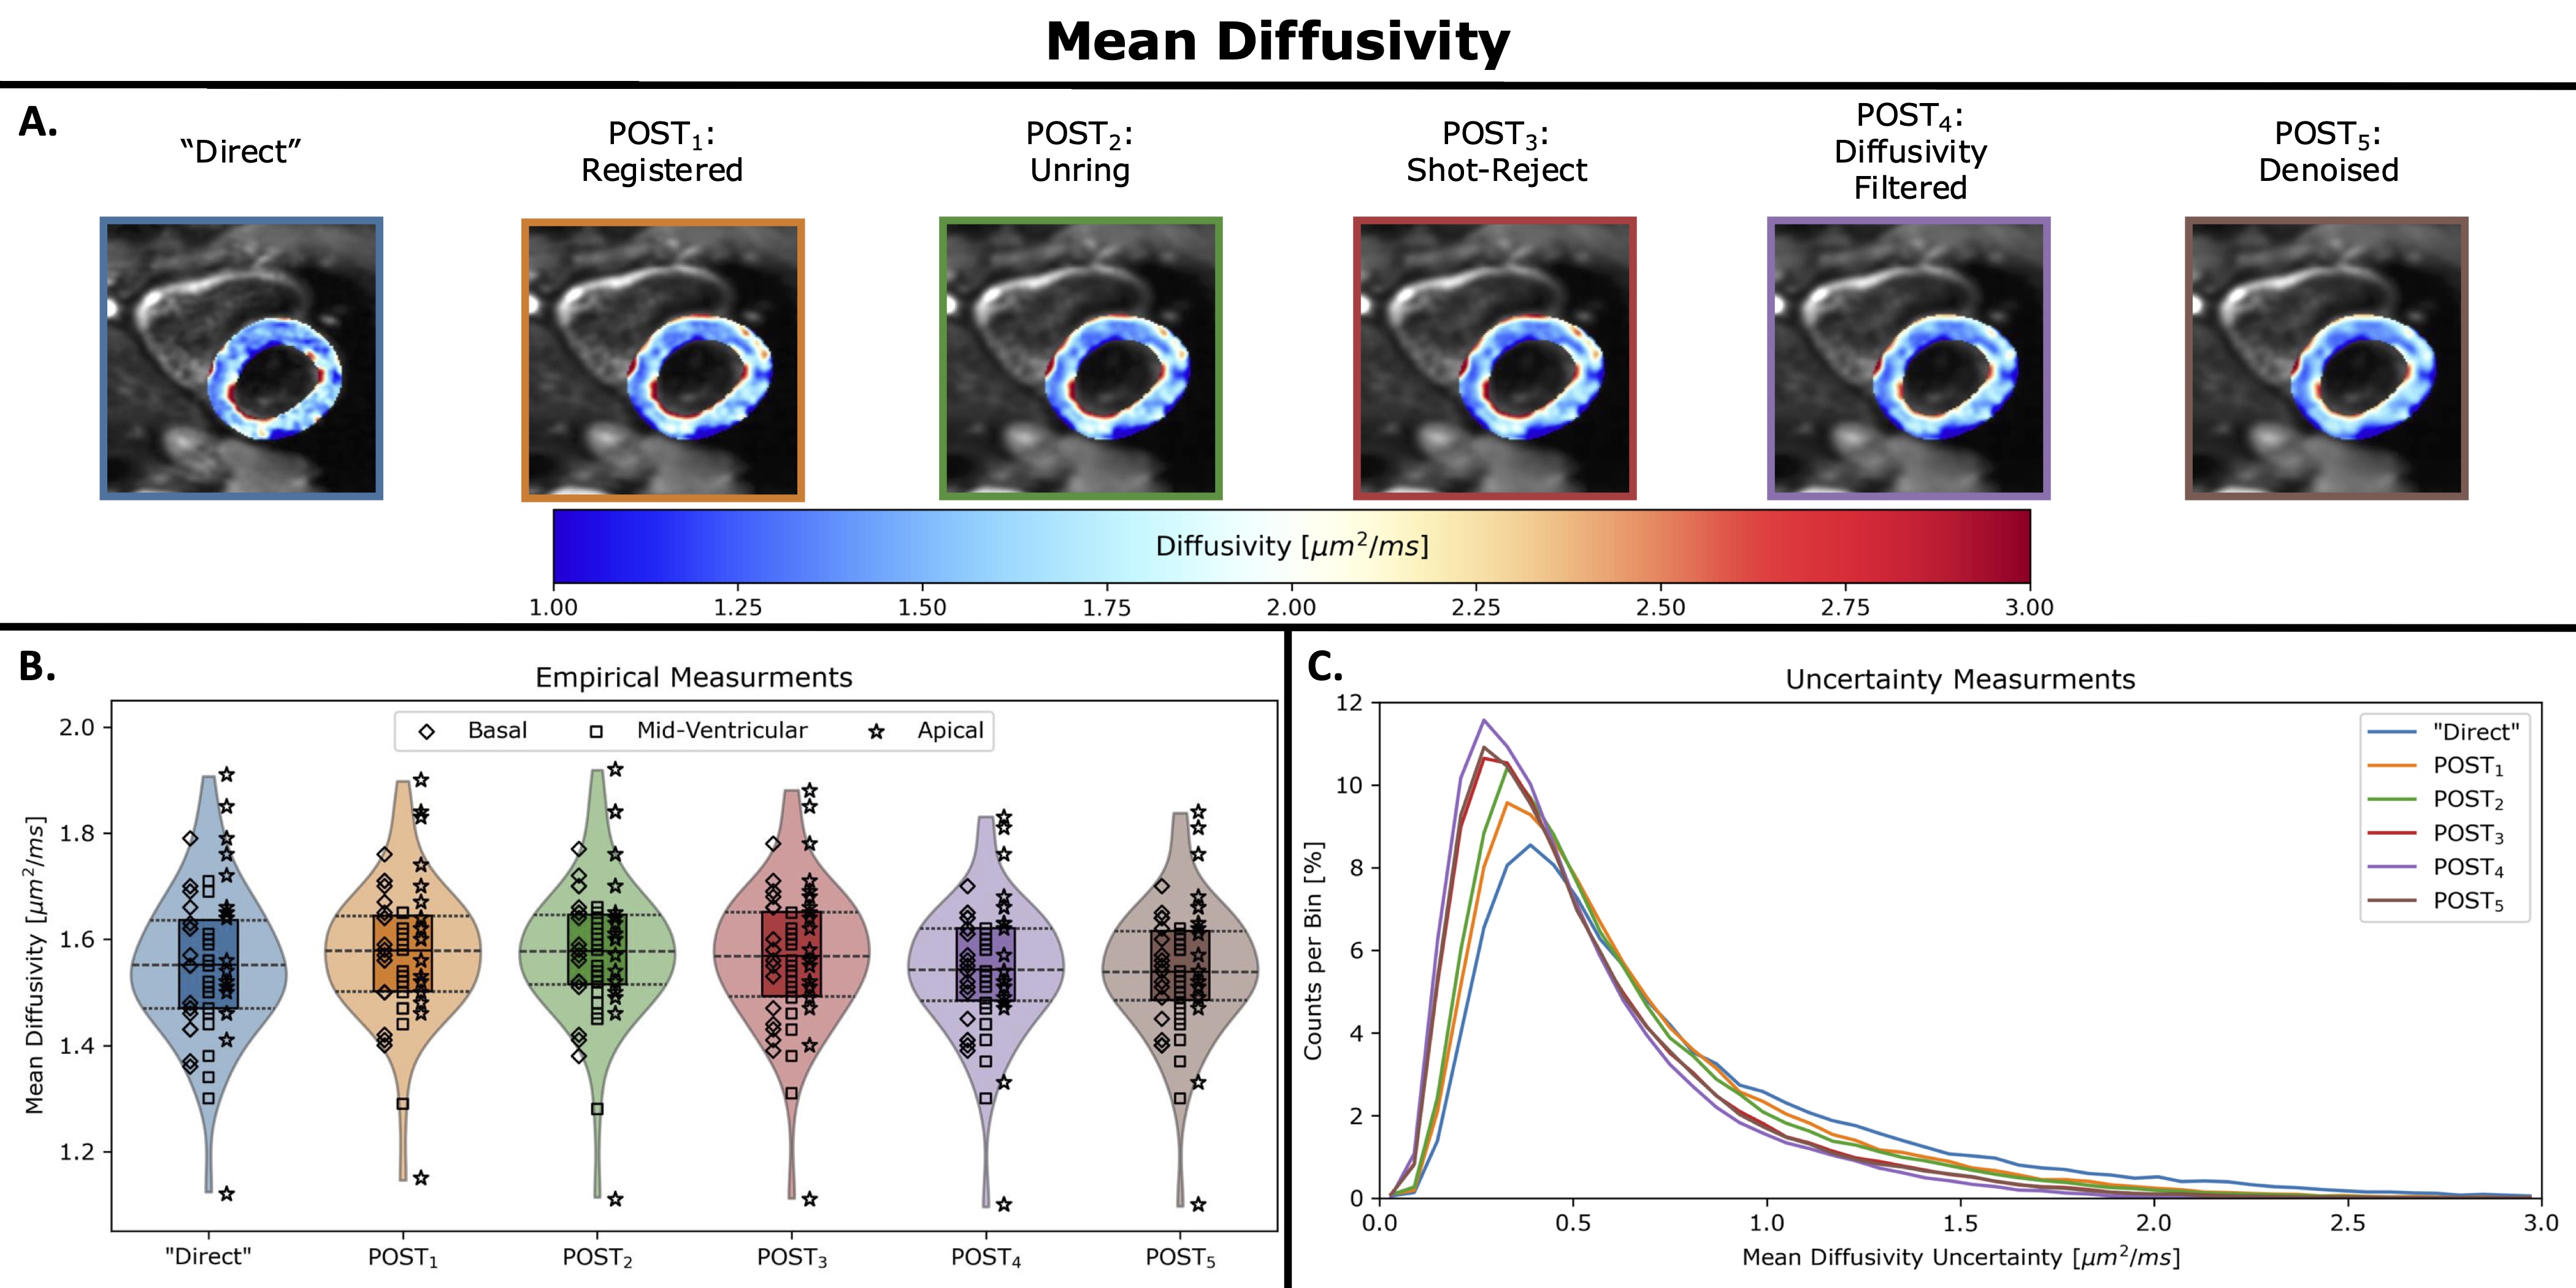
Figure 2A: Qualitative images displaying fractional anisotropy (FA) for a single volunteer at a left ventricular (LV) mid-ventricular slice for each module post-processing step (POST). Figure 2B: Median values of FA for LV slices across all volunteers. The median values of FA across POSTs showed a decreasing trend from “Direct” to POST5 (Denoised) with a maximum percent change of 19.2% when comparing “Direct” to POST5 (Denoised). Figure 2C: Uncertainty measurements of FA (all LV voxels for all slice across all volunteers) showed a general trend of decreased maximum likelihood from “Direct” to POST3 (Shot-Reject). POST3 (Shot-Reject) to POST5 (Denoise) displayed similar trends of uncertainty for FA.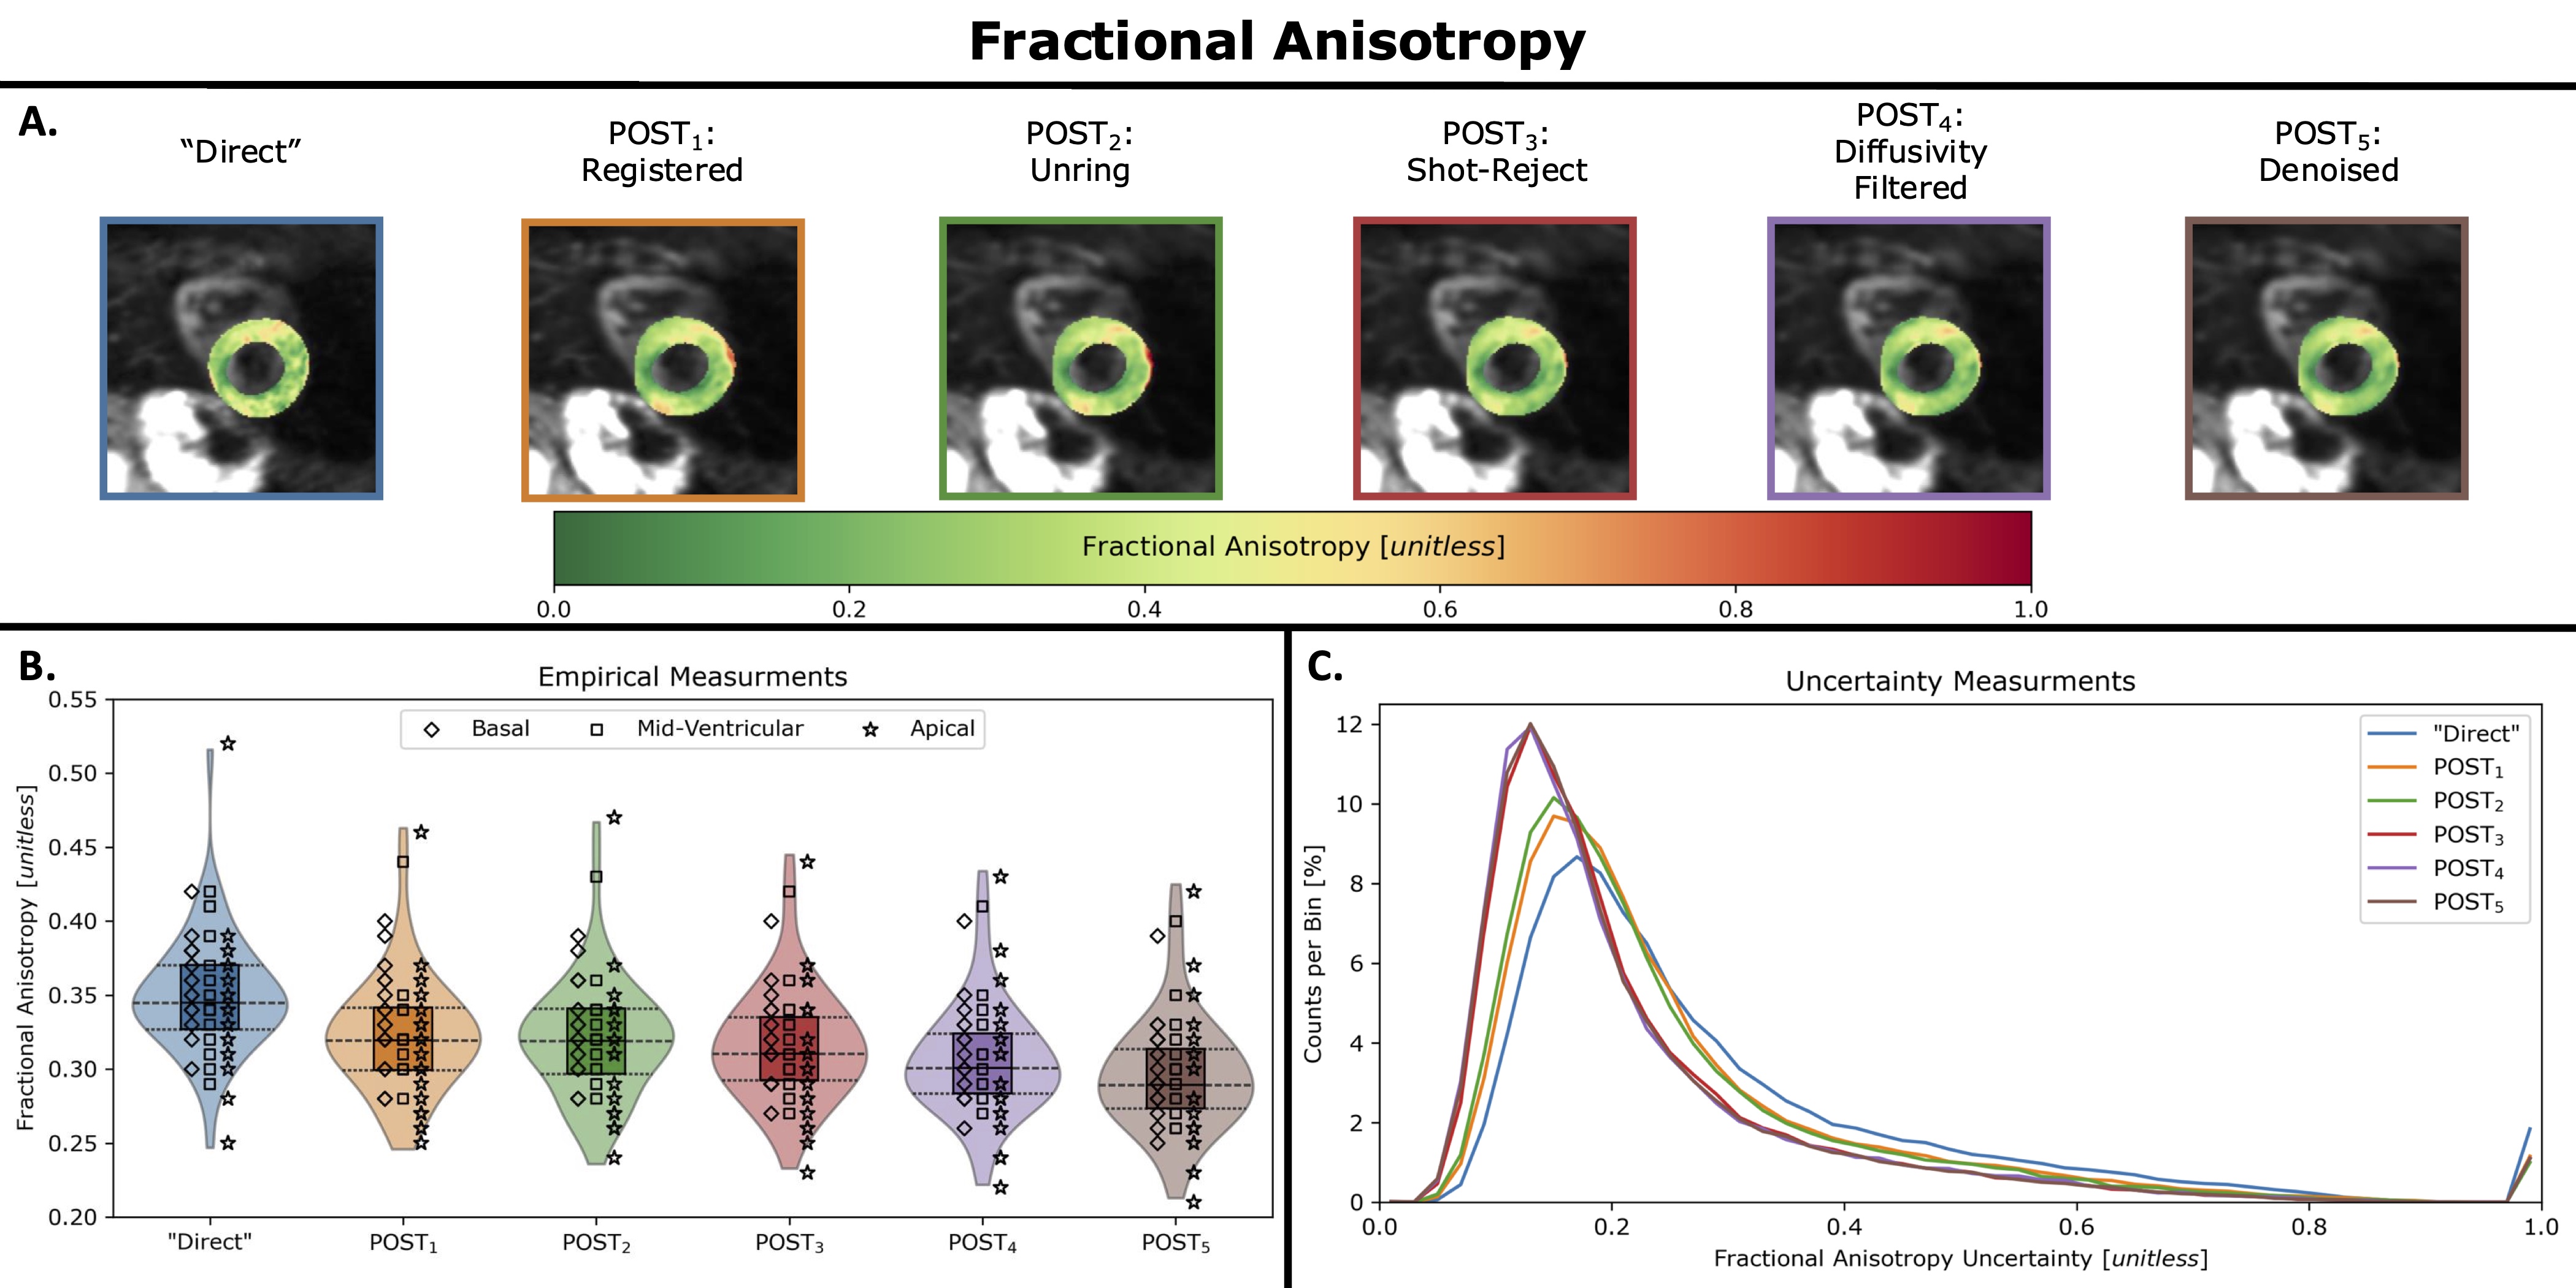
Figure 3A: Qualitative images displaying helix angle (HA) for a single volunteer at a left ventricular (LV) mid-ventricular slice for each post-processing step (POST). Figure 3B: Median values of HA pitch (HAP) for LV slices across all volunteers are visualized. The median values of HAP across POSTs were generally stable. Results from POST1 to POST5 were all improved compared to “Direct”, while a maximum percent change of 19.5% is observed when comparing “Direct” to POST3 (Shot-Reject). Figure 3A: Uncertainty measurements of the primary eigenvector (all LV voxels for all slice across all volunteers) showed a consistent maximum likelihood across all POSTs.