Rapid Fire Abstracts
Thara Nallamothu, BA
PhD Candidate
Northwestern University
Thara Nallamothu, BA
PhD Candidate
Northwestern University
Justin Baraboo, MSc
PhD candidate
Northwestern University

Elizabeth Weiss, PhD
MD/PhD student
Northwestern University

Joshua D. Robinson, MD, FSCMR
Section Head, Cardiac Imaging
Lurie Children's Hospital of Chicago
Lurie Children's Hospital

Cynthia K. Rigsby, MD
Chair
Ann & Robert H. Lurie Children's Hospital of Chicago

Christopher W. Roy, PhD
Lecturer
Lausanne University Hospital (CHUV) and University of Lausanne (UNIL), Switzerland

Mathias Stuber, PhD
Full Professor
CIBM-CHUV-UNIL
Laussane University, Switzerland

Michael Markl, PhD
Professor
Northwestern University Feinberg School of Medicine
This IRB-approved study included a prospectively recruited cohort of 19 TOF patients s/p repair (age 19±9 years) and 10 healthy volunteers (age 40±22 years). All subjects underwent 5D flow MRI with flow images provided for 4 respiratory phases (Fig. 1). Each subject’s aorta and MPA were segmented at end-expiration and registered to all respiratory states. Total kinetic energy (KE) and viscous energy loss (EL) were computed over the cardiac cycle and normalized to vessel volume7. Relative changes in KE, EL, and EL fraction (EL/KE) in each respiratory state were computed as the percent change from the mean. Significant alterations in respiration-driven dynamics were assessed using the interaction term of two-way ANOVA tests with cohort and respiratory state as predictors. In a sub-cohort of 13 patients, excluding PV susceptibility artifact (n=5) and non-valved RV-PA conduit (n=1), PR in each respiratory state was computed as the fraction of reverse flow vs. forward flow through a 2D plane and correlations with and clinically reported PR values, right ventricular stroke volume (RVSV), end diastolic volume (RVEDV) were assessed.
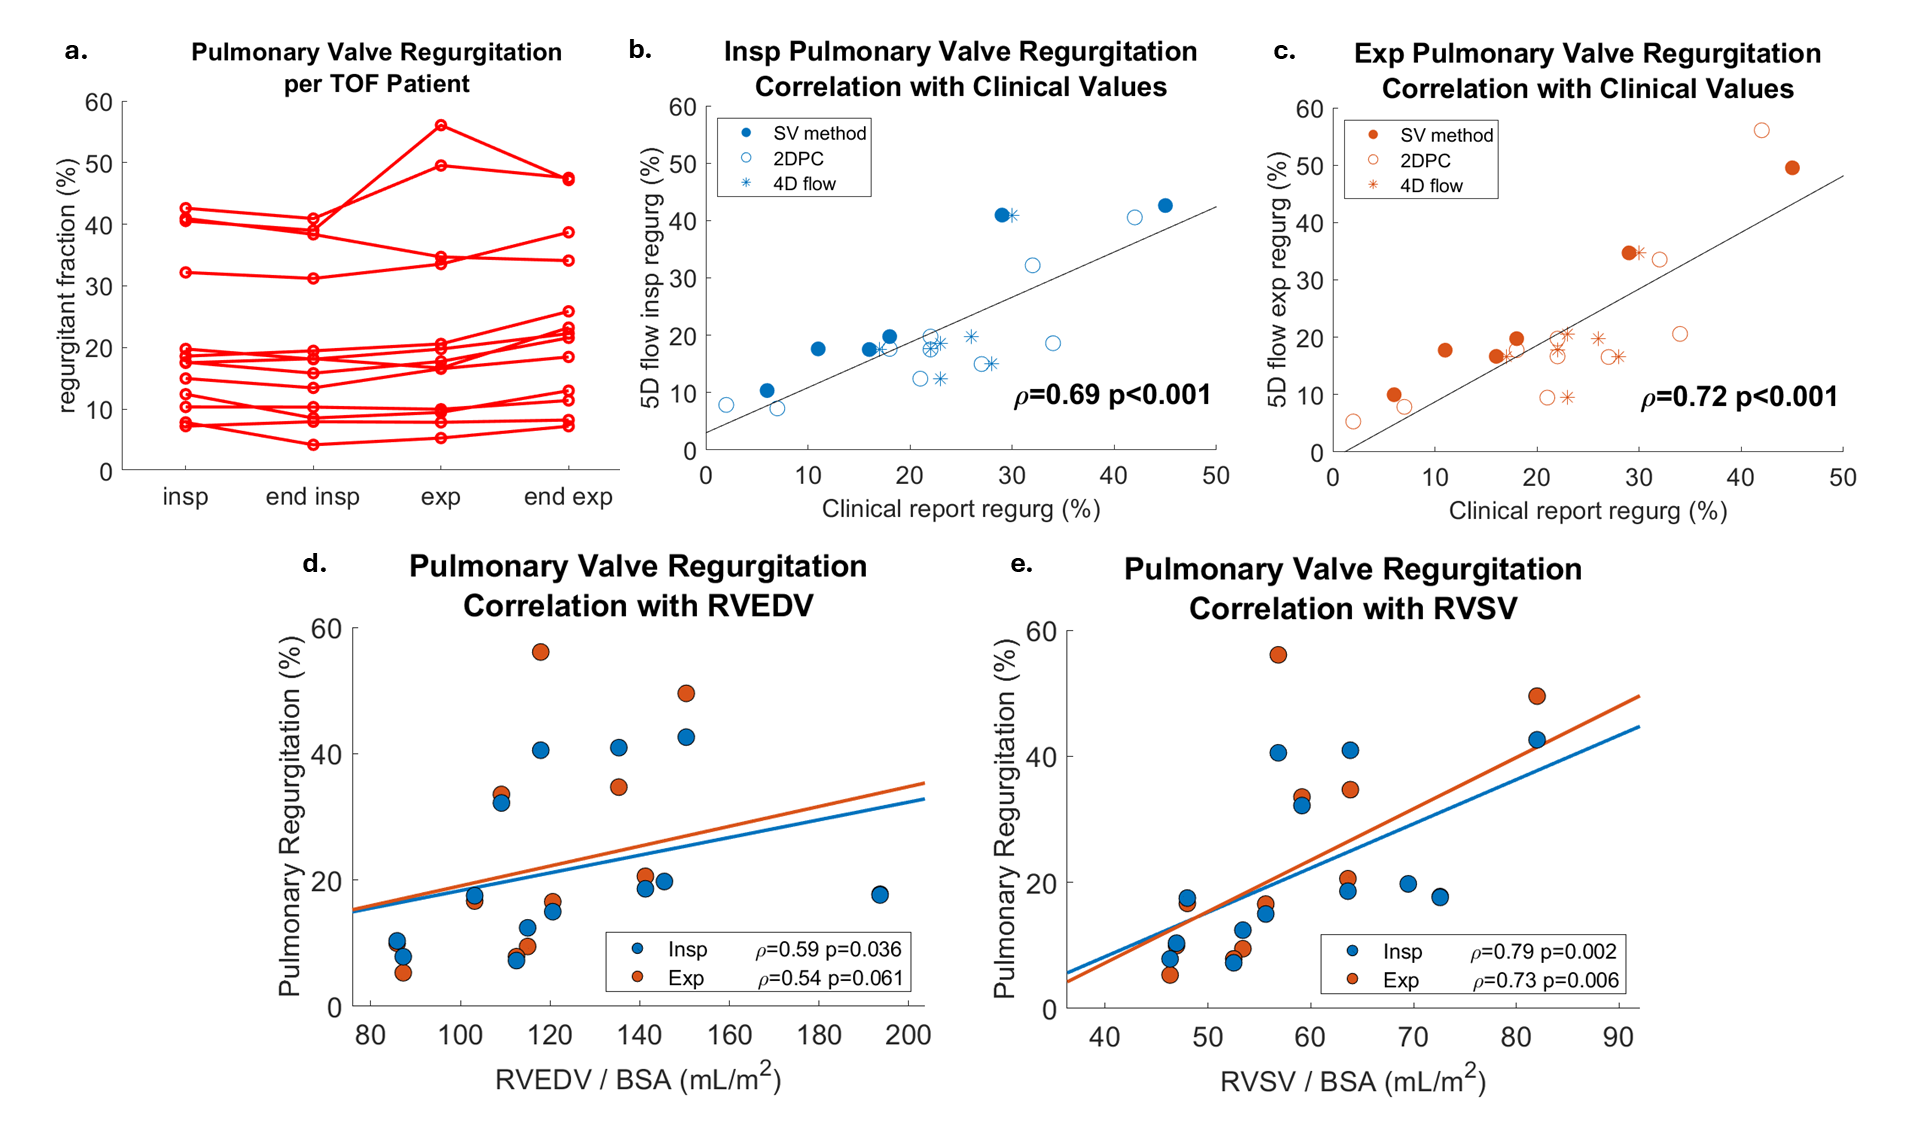
Results: TOF patients had elevated mean velocity, KE, and EL in the MPA across all respiratory states. Respiration-driven dynamics in MPA KE were significantly altered in TOF patients, with increases at end-inspiration and decreases at end-expiration (Fig. 2a). EL dynamics were not significantly altered, but EL fraction dynamics were, with an increase at end-expiration (Fig. 2b). PR was increased during expiration (Fig. 3a). Compared to other respiratory states, expiratory PR values were most strongly correlated with clinically reported PR values from 2D flow and 4D flow (Fig. 3b-c). Interestingly, inspiratory PR had the strongest correlation with RVSV and RVEDV (Fig. 3d-e).
Conclusion:
The results of this study indicate that respiration may modulate MPA blood flow dynamics in TOF patients. Decreased KE and increased EL fraction indicate a drop in flow efficiency at end-expiration. This is reflected by increased expiratory PR contributing to complex changes in the pulmonary flow pattern. Despite this, the inspiratory PR correlation with RV functional parameters indicates that the more efficient respiratory regime may be the more important driver of clinical outcomes. These results highlight the importance of using respiration-resolved modalities such as 5D flow to fully capture hemodynamic changes in TOF patients.
Figure 1: Respiratory-resolved 5D flow MRI and analysis pipeline. 5D flow MRI provided magnitude and flow volumes for 4 respiratory phases. Kinetic energy and energy loss were computed in the aorta and MPA in each volume. 5D flow MRI scan parameters: spatial resolution 2.5x2.5x2.5 mm, temporal resolution 40 ms, venc 150-250 m/s.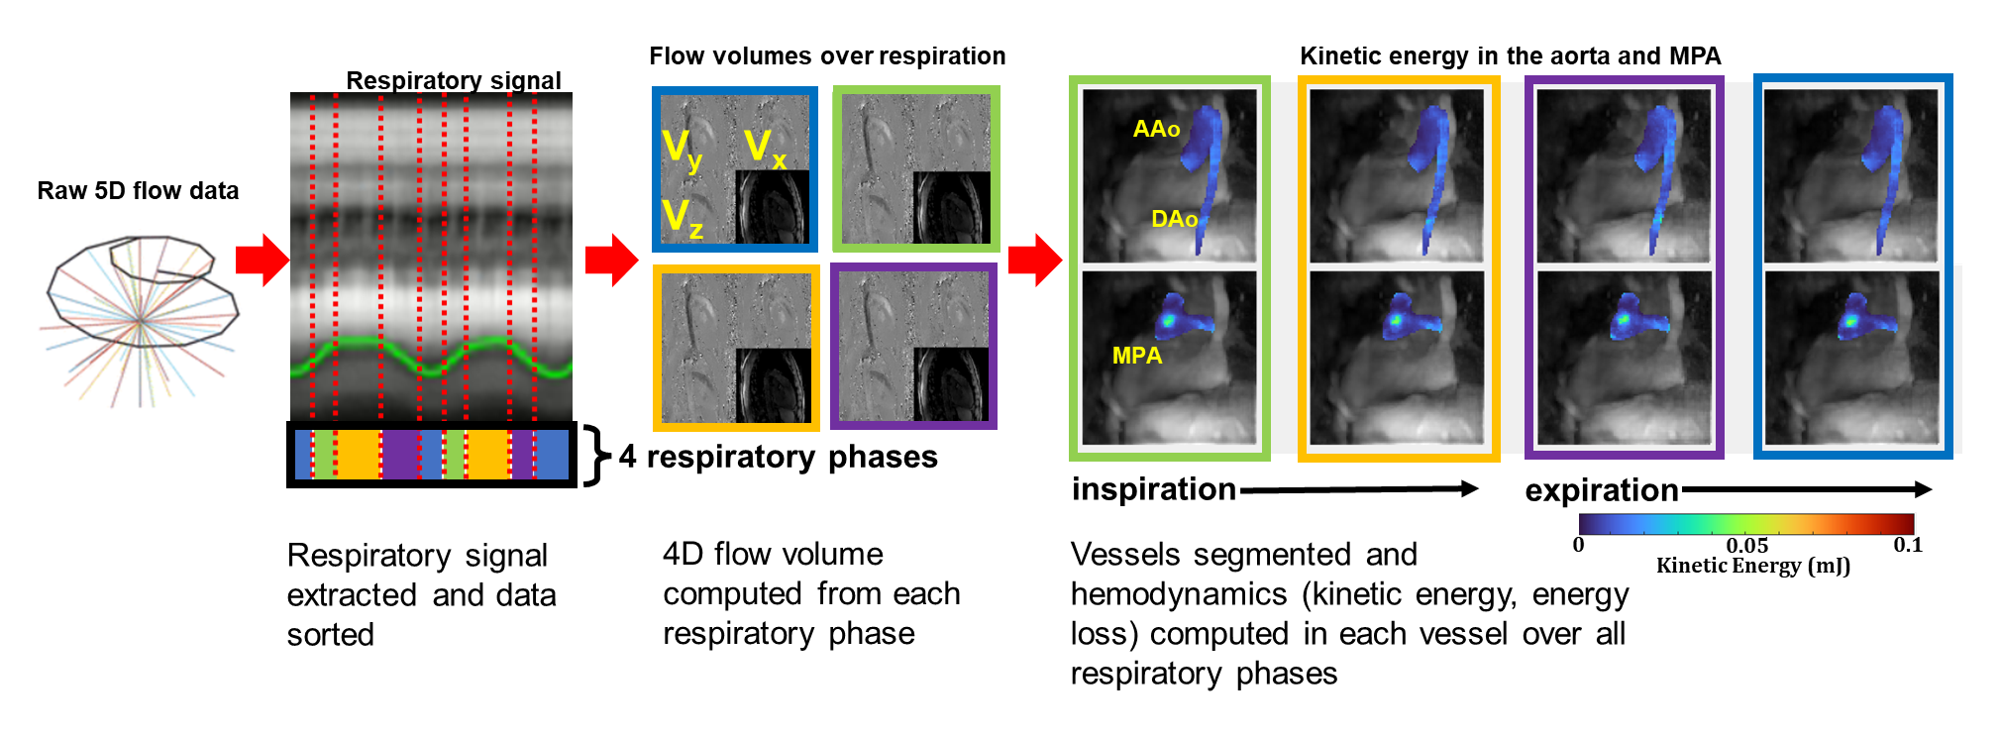
Figure 2: Respiration-driven alterations in flow energetic dynamics. a) Mean and standard deviation of relative change in kinetic energy in the MPA and aorta of TOF patients (red) and healthy volunteers (gray). b) Mean and standard deviation of relative change in energy loss fraction (energy loss / kinetic energy). Significant alterations in respiration-driven dynamics were assessed using the interaction term of two-way ANOVA tests with cohort and respiratory state as predictors. c) Average values of peak velocity (95th percentile), total kinetic energy, and total energy loss over the respiratory cycle. Significant differences between TOF and control were assessed using t-tests or Wilcoxon rank-sum depending on normal distribution of the data. (* p<0.05, ** p<0.01, *** <0.001)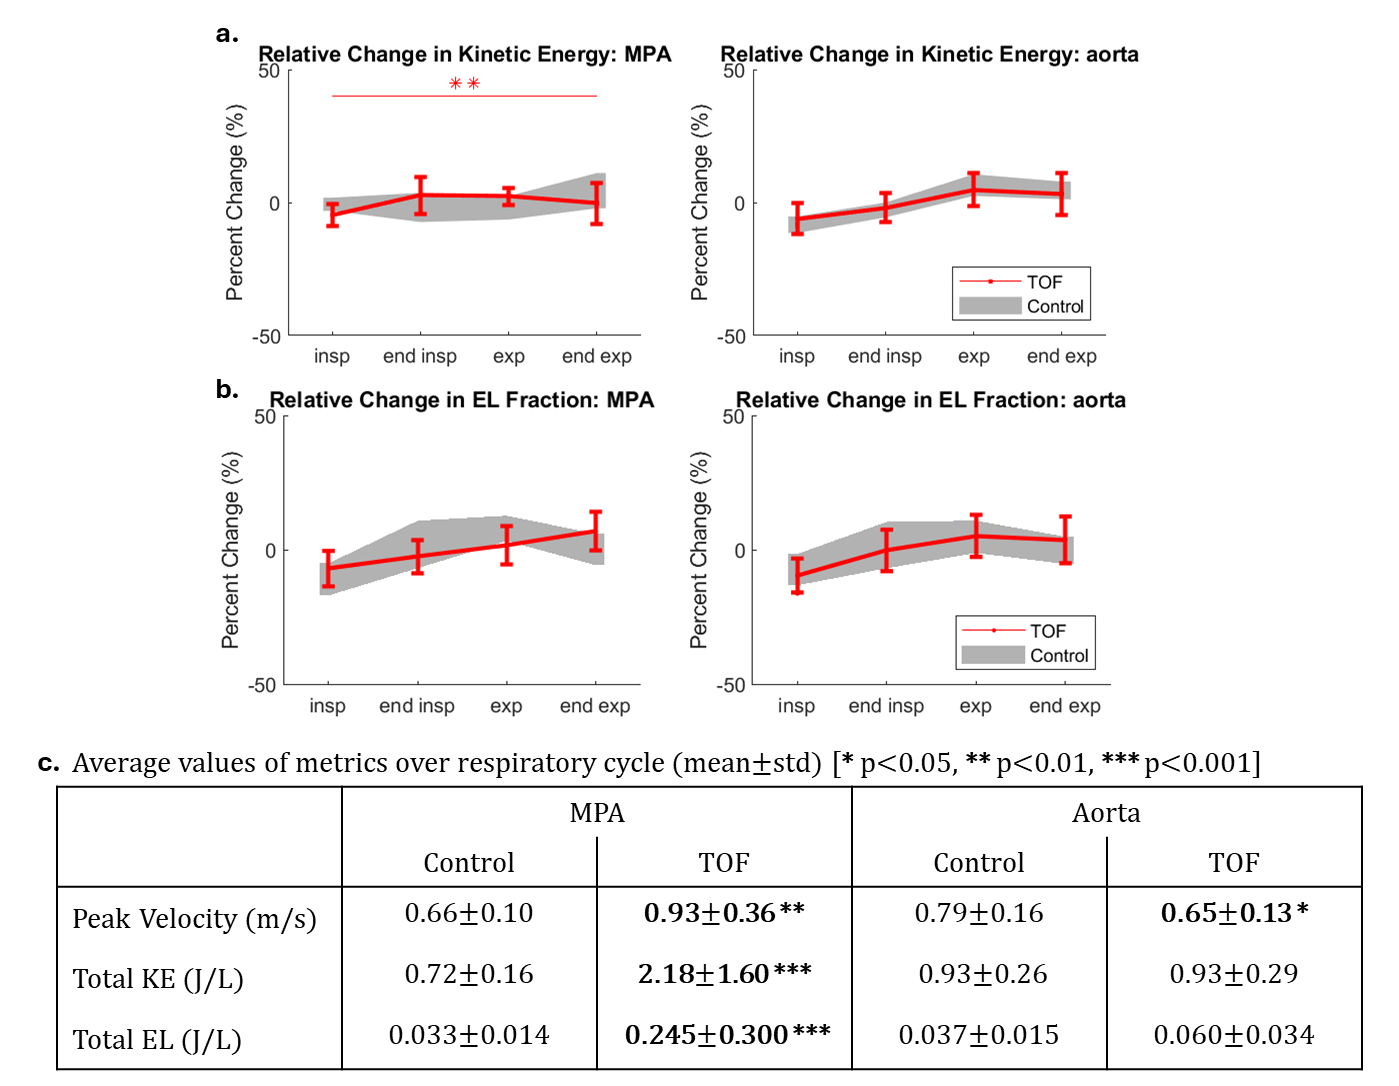
Figure 3: 5D flow pulmonary valve regurgitation (PR) with clinically reported values and RV function. a) PR values computed in each respiratory state displayed per TOF patient. b) Spearman correlation of inspiratory 5D flow PR with clinically reported PR values. Clinically reported values were derived using cine stroke volume difference, 2D flow, or 4D flow MRI. c) Correlation of expiratory 5D flow PR with clinically reported values. d) Correlation of inspiratory (blue) and expiratory (orange) PR with RVEDV. e) Correlation RVSV.