Oral Case
Hussein Daoud, MD
Cardiovascular Diagnostic Imaging Fellow
The Ohio State University
Hussein Daoud, MD
Cardiovascular Diagnostic Imaging Fellow
The Ohio State University

Karolina M. Zareba, MD
Associate Professor
The Ohio State University
Matthew S. Tong, DO
Associate Professor - Clinical
The Ohio State University

Juliet Varghese, PhD
Research Assistant Professor
The Ohio State University

Orlando P. Simonetti, PhD
Professor
The Ohio State University
Ning Jin, PhD
Senior Key Expert
Siemens Healthineers
Kelvin Chow, PhD
MR Collaboration Scientist
Siemens Healthcare Ltd., Canada, Canada
Katarzyna E. Gil, MD, PhD
Assistant Professor
The Ohio State University
A 74-year-old African American male with hypertension, heart failure with mildly reduced left ventricular (LV) ejection fraction (EF), and pulmonary sarcoidosis presented with exertional chest pain. Holter monitor revealed frequent premature ventricular contractions and intermittent Mobitz I second-degree atrioventricular block. Given the concern for cardiac sarcoidosis and ischemia, stress cardiovascular magnetic resonance (CMR) was ordered.
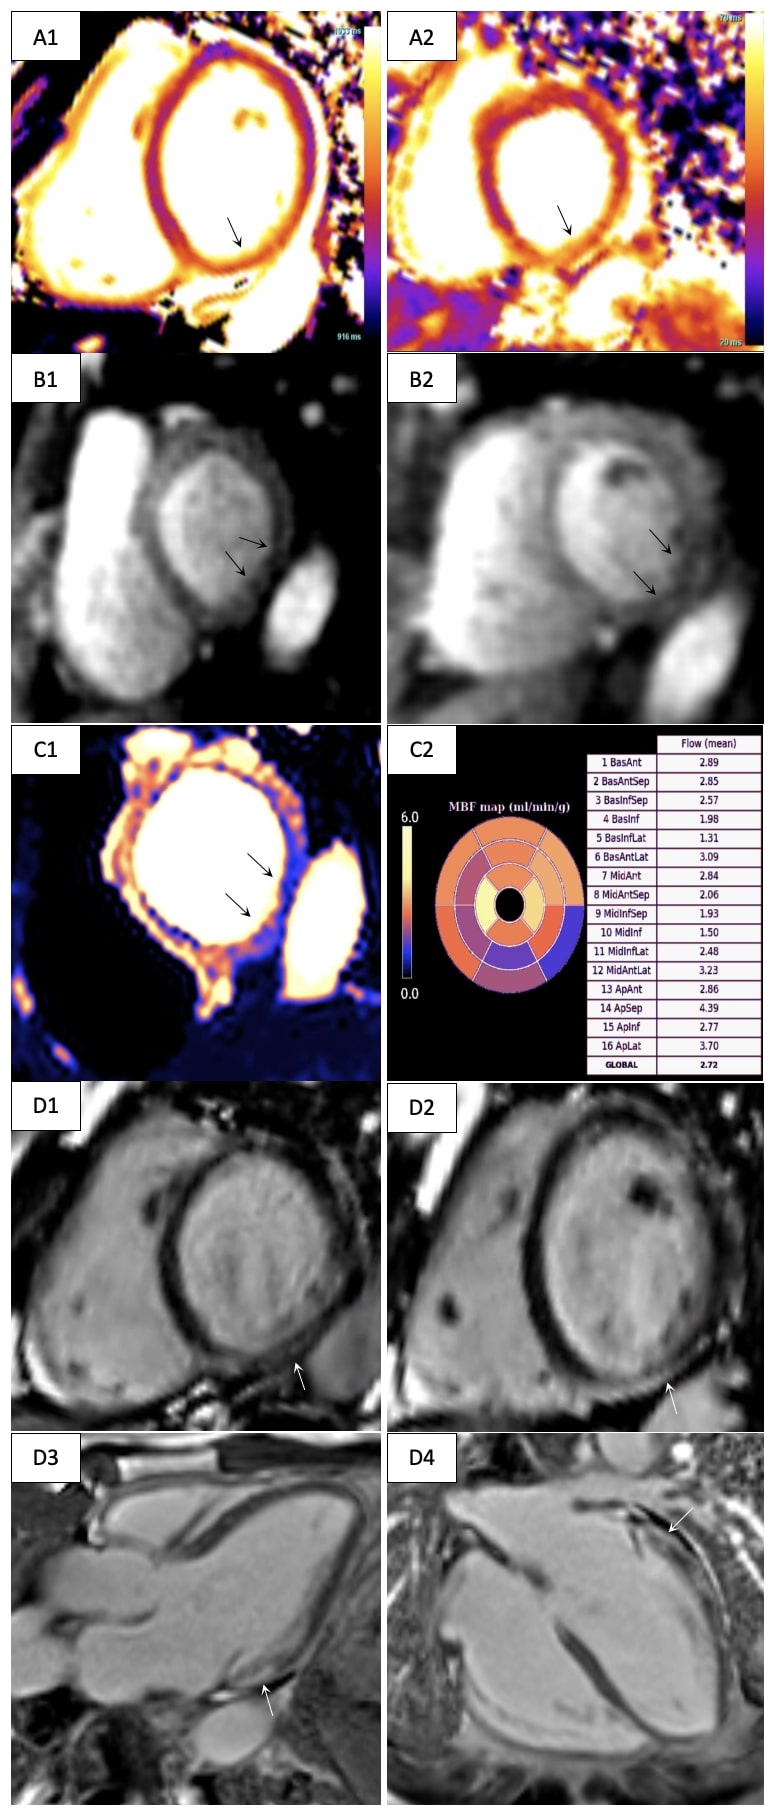
Diagnostic Techniques and Their Most Important Findings: Adenosine stress CMR was performed at 3T (MAGNETOM Vida, Siemens Healthineers, Forchheim, Germany) with cine imaging, T1 mapping (MOLLI), T2 mapping (T2-prepared GRE), a quantitative stress perfusion research sequence (GRE-based dual sequence) and late gadolinium enhancement (LGE) imaging (phase-sensitive inversion recovery bSSFP). The LV was mildly dilated (end-diastolic volume index 104 ml/m2) with mild systolic dysfunction (LVEF 47%). The right ventricle had normal size and function. Parametric mapping was significantly abnormal with pre-contrast native T1 values (1430 ms, normal < 1268 ms based on institutionally established normative data) and T2 values (47 ms, normal < 43 ms) being significantly elevated in the inferior and inferolateral walls (Figure 1 A). Qualitative and quantitative stress perfusion imaging demonstrated transmural perfusion defects in the basal-mid inferior and inferolateral walls (Figure 1 B-C) with a myocardial blood flow (MBF) of 1.31-1.98 ml/min/g. MBF in remote territories was normal (2.72-2.93 ml/min/g). LGE imaging demonstrated corresponding prominent subepicardial nonischemic fibrosis (Figure 1 D).
Learning Points from this Case:
Quantitative perfusion imaging with assessment of myocardial blood flow enables detection of epicardial coronary artery disease (CAD) and microvascular disease1. Given the abnormal regional perfusion, our patient underwent cardiac catheterization which demonstrated nonobstructive CAD. CMR findings were consistent with an inflammatory cardiomyopathy2, with concern for cardiac sarcoidosis. Although regional stress perfusion defects are usually associated with obstructive CAD, our case demonstrates that they may also be secondary to myocardial inflammation and nonischemic fibrosis. The patient is undergoing evaluation for implantable cardiac defibrillator for primary prevention, as the subepicardial LGE pattern carries a higher risk of arrhythmic and heart failure events3.
Data regarding myocardial inflammation and stress CMR is limited, but prior studies have shown nonischemic fibrosis is an independent predictor of decreased stress MBF4. Positron emission tomography myocardial perfusion imaging studies have also demonstrated that quantitative perfusion defects may persist for several months after diagnosing myocarditis5.
This case displays the value of quantitative stress CMR in detecting pathologies beyond the coronary vasculature that may also alter perfusion and impact the clinical course.
Figure 1. Cardiovascular magnetic resonance imaging in a patient presenting with exertional chest pain. A. Base short-axis T1 (A1) and T2 (A2) maps with elevated values in the inferior and inferolateral walls (arrows). B. Base (B1) and mid short-axis (B2) adenosine stress first-pass perfusion imaging with perfusion defects demonstrated in the inferior and inferolateral walls (arrows). C. Quantitative perfusion map (C1, arrows) with abnormal stress myocardial blood flow in similar myocardial territories (C2). D. Nonischemic subepicardial myocardial fibrosis along the basal inferior and lateral walls partially extending into the mid segments (arrows; D1 – base short-axis view, D2 – mid short-axis view, D3 – three-chamber view, D4 – horizontal long-axis view).