
Oral Abstract
Chia-Chi Yang, MSc
PhD Student
Cedars-Sinai Medical Center, Los Angeles, CA, United States
Chia-Chi Yang, MSc
PhD Student
Cedars-Sinai Medical Center, Los Angeles, CA, United States
Li Ting Huang, MD
Research associate
Cedars Sinai Medical Center
Archana V. Malagi, PhD
Postdoctoral Scientist
Cedars-Sinai Medical Center
Yuheng Huang, MS
Visiting Graduate Researcher
Radiology and Imaging Sciences, Indiana University School of Medicine
Ghazal Yoosefian
Student
Indiana University School of Medicine
.jpg "Xinheng Zhang, MSc photo")
Xinheng Zhang, MSc
Graduate Researcher
University of California, Los Angeles
Xingmin Guan, PhD
Postdoctorral Fellow
Indiana University
Hsu-Lei Lee, PhD
MR Physicist
Cedars-Sinai Medical Center
Xiaoming Bi, PhD
Director, Cardiovascular MR Collaborations
Siemens Medical Solutions USA, Inc.
Chang Gao, PhD
Sr Scientist
Siemens Healthineers
Fei Han, Ph.D.
Senior Scientist
Siemens Medical Solutions USA, Inc.

Anthony G. Christodoulou, PhD
Assistant Professor
University of California, Los Angeles (UCLA)

Debiao Li, PhD
Professor
Cedars Sinai Medical Center
Hui Han, PhD
Associate Professor
Well Cornell Medicine

Rohan Dharmakumar, PhD
Executive Director
Indiana University School of Medicine
.jpeg "Hsin-Jung Randy Yang, PhD photo")
Hsin-Jung Randy Yang, PhD
Assistant Professor
Biomedical Imaging Research Institute, Cedars-Sinai Medical Center, Los Angeles, CA, USA
Myocardial oxygen consumption (MVO2) is a central marker in measuring cardiac energetics [1]. Current methods for quantifying MVO2 are inaccessible due to the requirement of invasive procedures or PET agents that require onsite cyclotrons. To overcome this challenge, we developed a free-breathing, non-ECG-gated, motion-resolved Cardiac MR blood oximetry technique [2] that can noninvasively quantify MVO2 in standard clinical MRI scanners without ionizing radiation and contrast agents.
Methods:
A free-breathing, ungated 3D Radial GRE T2 Prep-IR sequence with flow compensation and water excitation sequence was developed and described in Fig.1. Images were reconstructed using a Low-Rank Tensor (LRT) framework to derive the corresponding blood oxygenation saturation (SbO2) level, the hematocrit (Hct) and the arterio-venous oxygen difference (a-vO2 = DSbO2 between the LV and CS blood). We tested the developed sequence in anesthetized health pigs (n=9) and pigs with chronic infarction (n=3). The developed sequence was prescribed over a mid-ventricular slice and coronary sinus (CS) in a 3T MR System (Vida, Siemens Healthineers). Following MR oximetry acquisitions, 2D Phase contrast CMR was used to measure blood velocity in the CS to quantify myocardial blood flow (MBF) [3]. Total myocardial oxygen consumption (tMVO2= a-vO2 x MBF), and myocardial oxygen consumption per gram LV mass (MVO2/g = tMVO2 / diastolic LV mass) were derived using Fick’s law [4]. Acquisitions were performed at rest and under adenosine infusion. Following CMR, all animals were moved to the cardiac catheterization lab, and invasive estimates of CS flow and blood samples were obtained.
Results:
In healthy pigs, significantly increased CS SbO2 was observed in both CMR and invasive measurements during adenosine infusion. A set of representative images is displayed in Fig.2. CMR-based tMVO2 and MVO2/g under various physiological conditions are compared to invasive ground truth in Fig.3. Across all conditions, CMR-based MVO2 measurements were comparable to the invasive measurements. For healthy subjects, tMVO2 and MVO2/g during adenosine infusion were significantly lower than at rest (Fig 3A & 3B). The effect was accompanied by a significantly lower rate pressure product (RPP) showing reduced cardiac output. (RPP = 7979.32±687.19 mmHg/min vs 5774.62±1213.68 mmHg/min, p< 0.01). Similar results are measured in pigs with chronic MI. A strong trend of higher tMVO2 and lower MVO2/g was observable in pigs with chronic MI with both CMR and invasive measurements. (Fig. 3C &3D) Additional studies are being pursued to investigate this effect. (CMR tMVO2: Diseased 12.96±5.01 ml/min vs Healthy 8.55±2.77 ml/min, p = 0.08; Inv. tMVO2: Diseased 10.97±5.31 ml/min vs Healthy 7.86±3.09 ml/min, p = 0.22; CMR MVO2/g: Diseased 0.15±0.02 ml/min/g vs Healthy 0.18±0.06 ml/min/g, p = 0.41; Inv. MVO2/g: Diseased 0.13±0.04 ml/min/g vs Healthy 0.17±0.07 ml/min/g, p = 0.34).
Conclusion:
The proposed CMR approach can accurately quantify MVO2 with standard clinical MRI hardware. Although further studies are needed, our early findings indicate that the proposed approach has the potential to enable risk-free assessment of dysregulated myocardial metabolism in patients.
Figure 1. Free-running cardiac MR oximetry flowchart. Panel (A) shows the sequence diagram of the proposed T2prep-IR sequence with 6 inter-echo spacings (τ180), τ180= 0, 7.5, 15, 22.5, 27.5, 30 ms. Panel (B) demonstrates the LRT process [5]. During reconstruction, the basis of the SbO2 sensitive signals were estimated by the Bloch equation and the SbO2 2-compartment model [6], where Panel (C) displays the formula of the model [7,8].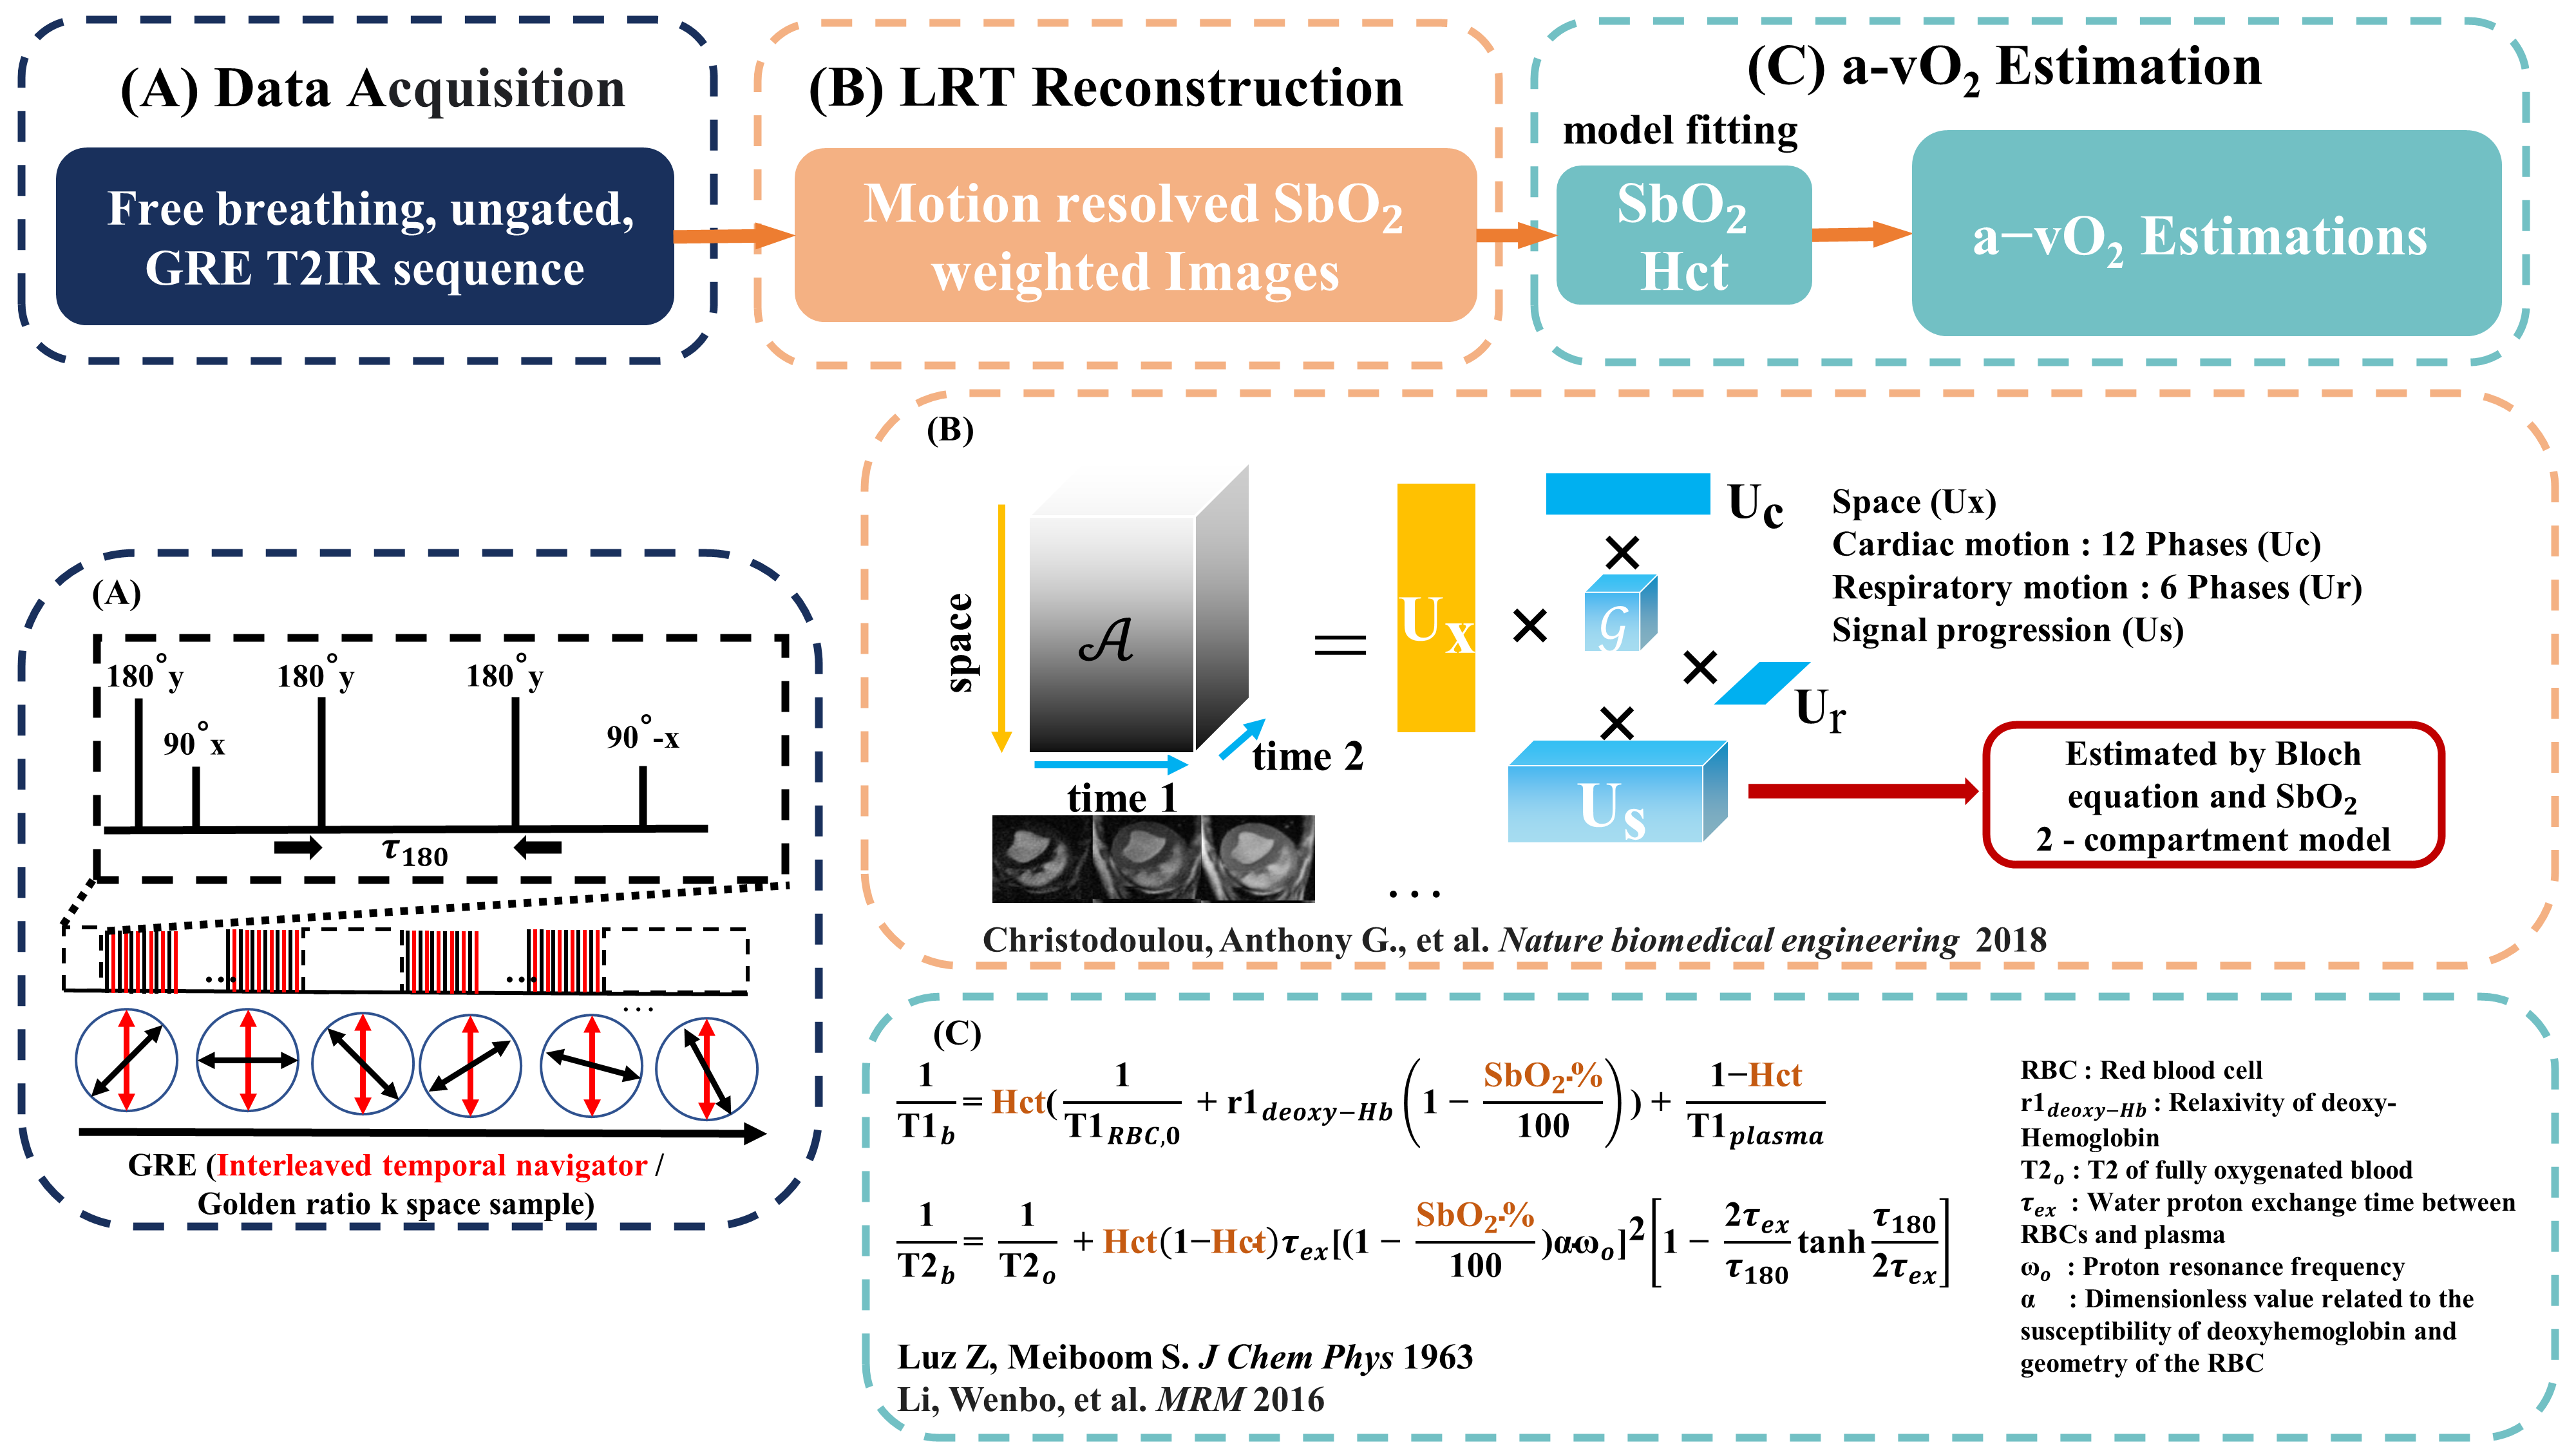
Figure 2. Representative reconstructed images and the corresponding SbO2 maps. Panel (A) and (B) respectively show the CINE images and the motion resolved SbO2 weighted images of an animal subject. The LV, RV and CS are labeled with different colors. Panel (C) presents the SbO2 Maps of the corresponding heart chambers under rest and adenosine infusion conditions. Significantly increased CS SbO2 is observed..png)
Figure 3. Comparison and analysis of tMVO2 and MVO2/g CMR-derived tMVO2 and MVO2/g for healthy and chronic subjects were compared to the invasive ground truth. Paired two sampled T-tests were done, and the p-value stated that the CMR estimations from the proposed method have statistically comparable means to the invasive results. .png)
