Oral Abstract
Daniel Wee
Student Research Assistant
Cleveland Clinic
Daniel Wee
Student Research Assistant
Cleveland Clinic
Danielle Kara, PhD
Staff Scientist
Cleveland Clinic
Thomas Garrett, BSc
Research Assistant
Cleveland Clinic
Masafumi Sugawara, MD
Research Fellow
Cleveland Clinic
Oussama Wazni, MD, MBA
Physician
Cardiac Electrophysiology and Pacing at Sydell and Arnold Miller Family Heart, Vascular & Thoracic Institute, Cleveland Clinic
Hiroshi Nakagawa, MD, PhD
M.D., Ph.D
Cleveland Clinic

Deborah Kwon, MD, FSCMR
Director of Cardiac MRI
Cleveland Clinic
David Chen, PhD
Director of Artificial Intelligence
Cleveland Clinic

Christopher Nguyen, PhD, FSCMR, FACC
Director, Cardiovascular Innovation Research Center
Cleveland Clinic
Introduction
Accurate quantification of myocardial scar size and heart function is crucial for evaluating cardiac health and predicting outcomes in patients with ischemic heart disease1. This study aims to validate AutoCMR, an automated whole thoracic exam with 3D isotropic cine and delayed enhancement (DE) imaging, in a pre-clinical setting by comparing its scar size measurement with TTC staining and conventional DE. Additionally, the accuracy of heart function analysis with AutoCMR was tested by comparing to conventional cine.
Methods:
Methods
Imaging was performed on a 3T Cima.X (Siemens Healthineers) in two male Yorkshire pigs 4 weeks post myocardial infarction (MI) with IACUC approval. 3D isotropic (1.6 mm, FOV=307mm) cine (GRE, TR/TE=4.0/2.9ms, FA=12°) and DE (IRGRE, pulse-ox gated, TR/TE=3.7/2.6ms, FA=10°) data was acquired post-contrast with AutoCMR. Conventional 2D cine (bSSFP, TR/TE=2.4/1.2ms, FA≤60°, 1.4mmx1.4mmx5mm) and DE were acquired in SAX, 2CH, and 4CH views with no slice gap.
Harvested pig hearts were frozen for 2 hours, then cut into 5 slices from apex to base2. Slices were stained with 1% TTC solution at 37°C for 20 minutes, followed by 10% formalin fixation for 20 minutes. The LV was manually segmented, and scar size was calculated as a percentage for each slice using ImageJ. These individual slice percentages were averaged to obtain the overall scar size.
AutoCMR data was retrospectively resampled to 4.8mm slice thickness in the SAX view. Heart function analysis of cine data was performed using 3D Slicer. Key functional parameters including left ventricular (LV) end diastolic volume (EDV), end systolic function (ESV), ejection fraction (EF), cardiac output (CO), and mass (LVM) were calculated using manual segmentations of the LV. For scar size analysis, the LV was manually segmented in DE slices where scarring was visible using Segment (Medviso) and scar volume and percentage for each imaging modality were calculated.
Results:
Results
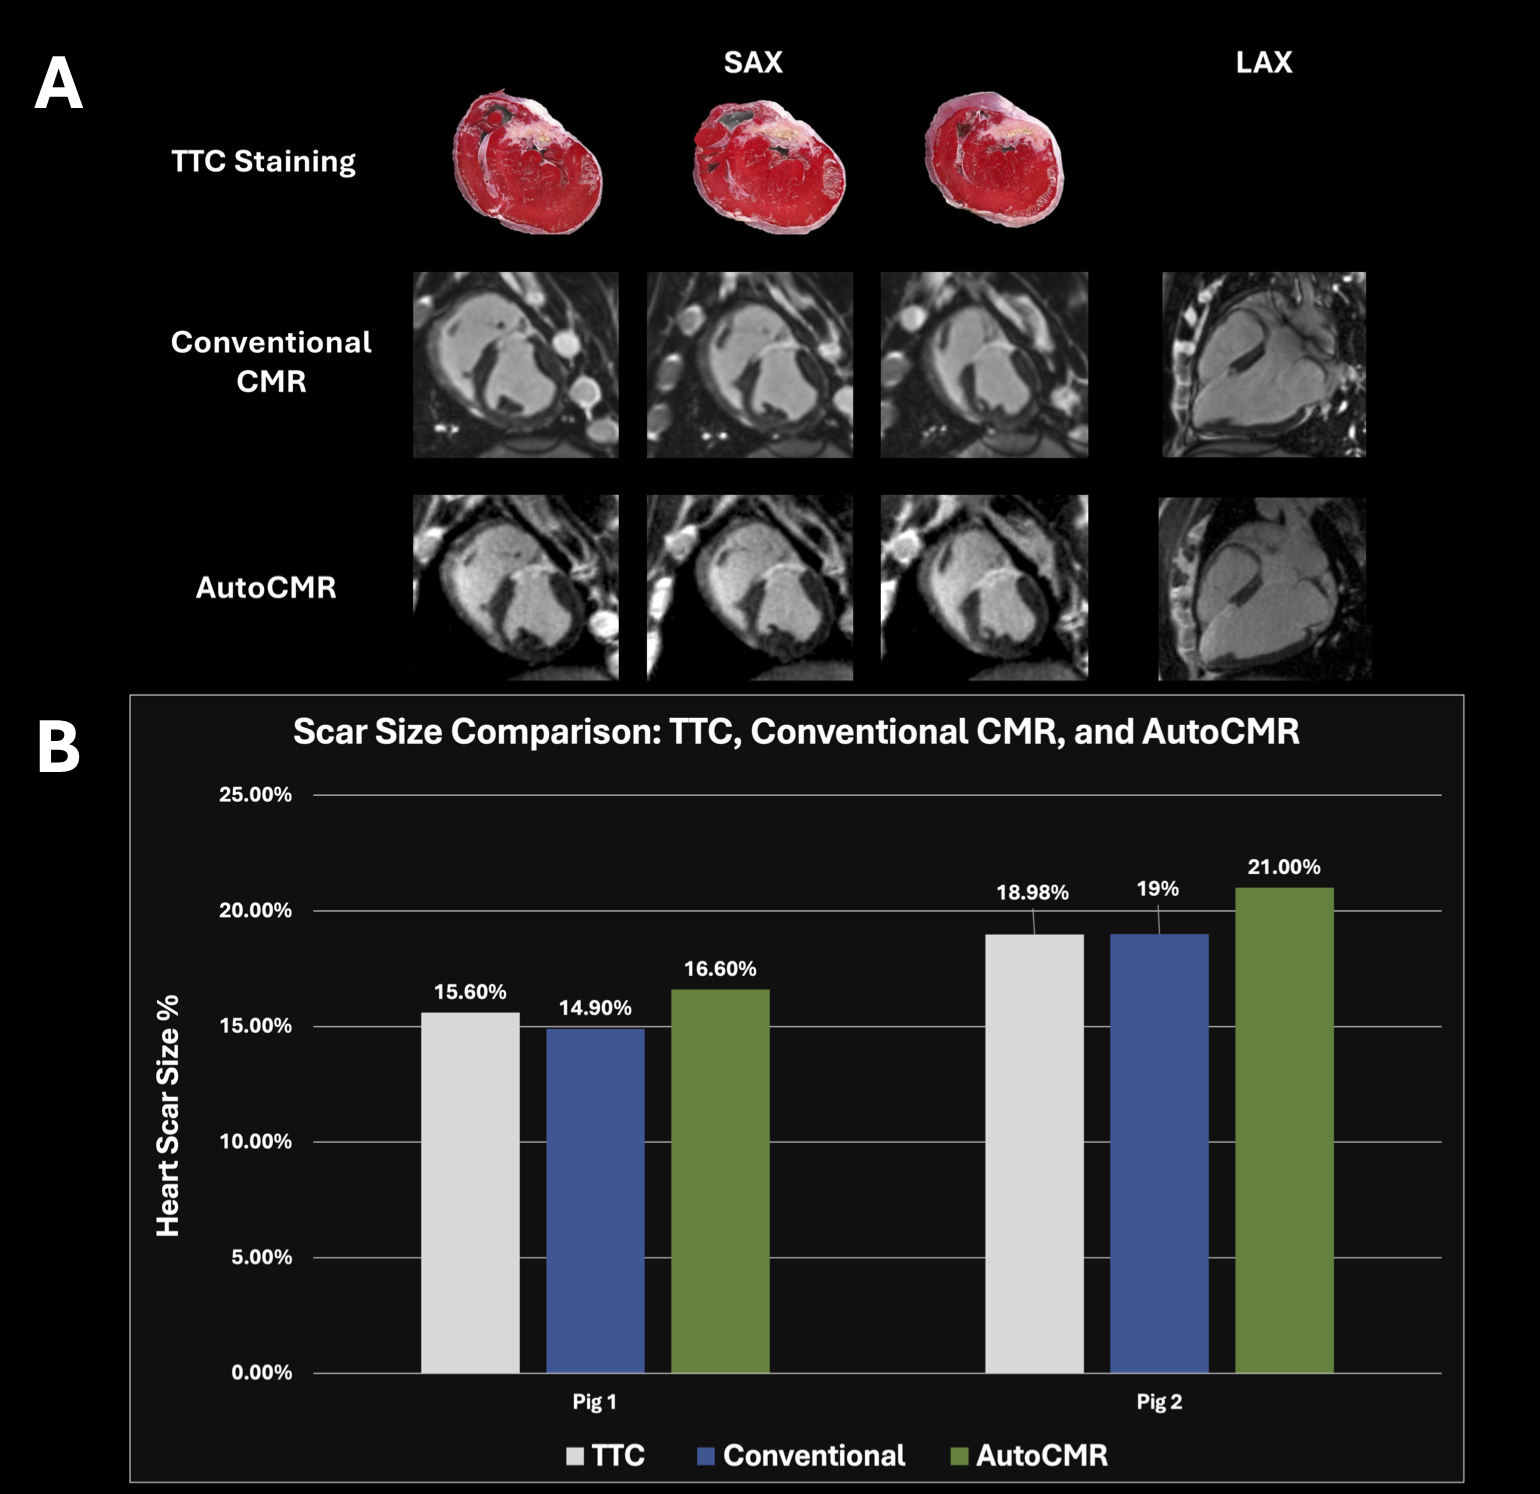
Scar size measurements were compared across TTC staining, conventional DE, and AutoCMR. For pig 1, the results were 15.6% (TTC), 14.9% (conventional), and 16.6% (AutoCMR). For pig 2, they were 19.0% (TTC and conventional) and 21.0% (AutoCMR). AutoCMR showed a slight tendency to overestimate scar %—with differences of +1.0 and +2.0% from TTC in the two pigs.
Heart function analysis revealed consistent results between AutoCMR and conventional CMR, despite banding artifacts in conventional CMR absent in AutoCMR. LV ejection fractions were within 3%. Other parameters—end-diastolic and systolic volumes, stroke volume, and cardiac output—showed similar close agreement.
Conclusion:
Conclusion
AutoCMR provided comparable results to conventional imaging in assessing scar size and heart function parameters with a slightly higher scar size. Its potential benefits include reduced scan time, and, thus, more efficient imaging. These findings, though promising, warrant further research to establish AutoCMR’s validity due to the small sample size.
Figure 1. Comparison of End-diastolic (A) and End-systolic (B) Cardiac MRI Images: Conventional CMR vs. AutoCMR. Images are shown for apical, mid-ventricular, and basal slices in short axis view—demonstrating the similarity in image qualities and LV shape visualization between the two methods across different cardiac phases.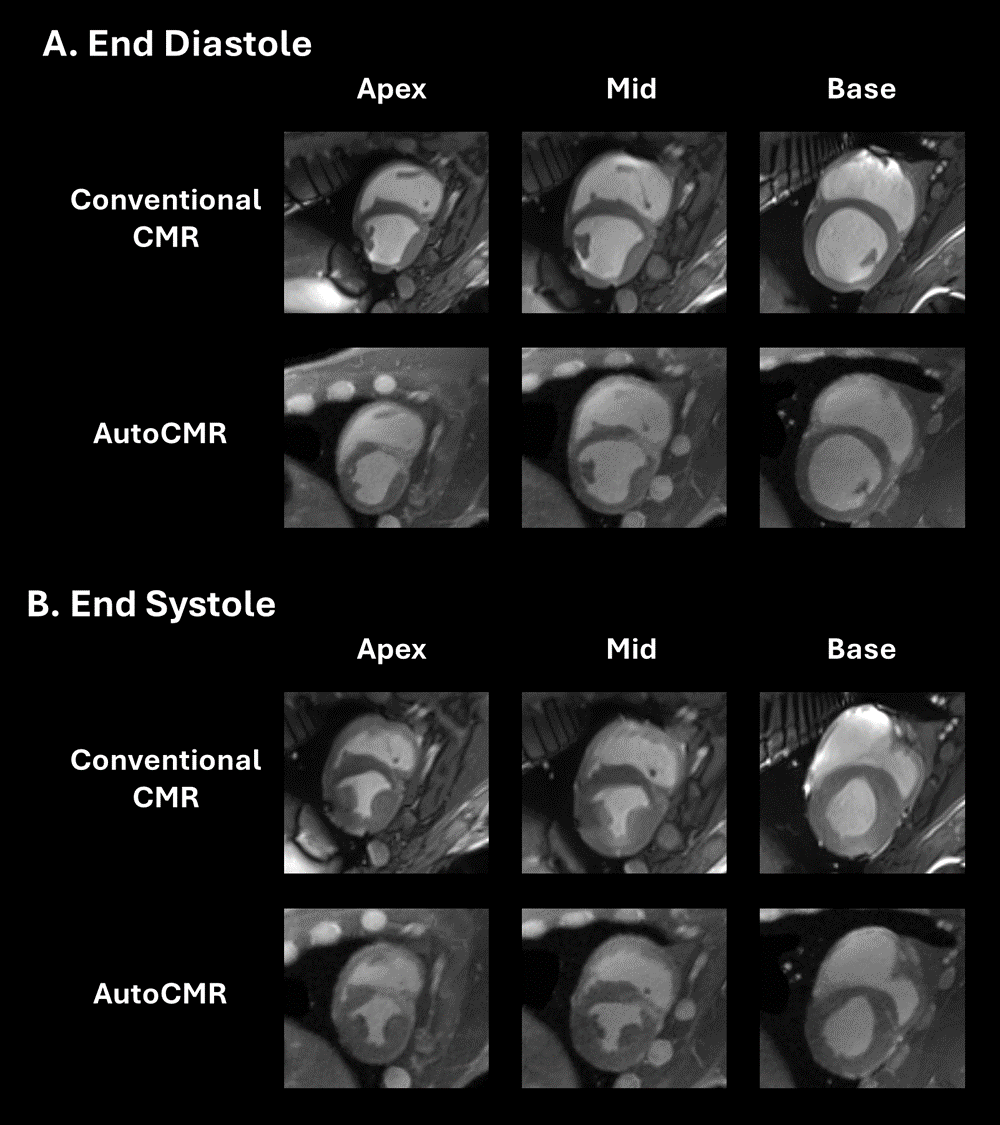
Figure 2. Multi-modality Comparison of Cardiac Scar Visualization: TTC (triphenyl tetrazolium chloride) Staining vs. Conventional CMR vs. AutoCMR. The figure shows the short-axis (SAX) and long-axis (LAX) views for both conventional CMR and AutoCMR, alongside the corresponding TTC-stained heart tissue sections for direct comparison of scar detection across modalities. B. Quantitative Comparison of Pig Heart Scar Size: TTC, Conventional CMR, and AutoCMR. Bar graph displaying the quantitative comparison of myocardial scar size in two pigs. The graph illustrates the relative accuracy of AutoCMR scar quantification compared to the established methods—highlighting its slight tendency to overestimate the scar size.