
Oral Case
MARIA BOUTSIKOU, MD, PhD, MSc, FESC, FSCMR
MRI/CT UNIT DIRECTOR
MEDITERRANEO HOSPITAL, Greece
MARIA BOUTSIKOU, MD, PhD, MSc, FESC, FSCMR
MRI/CT UNIT DIRECTOR
MEDITERRANEO HOSPITAL, Greece
EVANGELIA GRIGORAKI, MD, MSc
CONSULTANT CARDIOLOGIST
TZANEIO GENERAL HOSPITAL, Greece
PANAGIOTA PAPACHRISTOU, MD, PhD
CONSULTANT CARDIOLOGIST, DIRECTOR
PEDIATRIC HOSPITAL "AGLAIA KYRIAKOY", Greece
Dionysios Tsilidis
JUNIOR DOCTOR
MEDITERRANEO HOSPITAL, Greece
Dimitrios Koutsikos, MSc
Medical Physicist
MEDITERRANEO HOSPITAL, Greece
Evaggelos Vernardos
MRI/CT UNIT RADIOGRAPHER
MEDITERRANEO HOSPITAL, Greece
GEORGE KANOUPAKIS, MD
RADIOLOGIST
MEDITERRANEO HOSPITAL, Greece
A 12 year old boy was admitted to the hospital after an episode of loss of consciousness with grand mal seizures for approximately 10 minutes. His past medical history included weight loss (approximately 5kg the last 4 months) and frequent episodes of headache and nocturnal sweating. A few minutes after admission, the patient presented a new episode of seizures, so he was intubated and transferred to the ICU. Cardiac monitoring showed high blood pressure (200/138mmHg) and sinus tachycardia (200bpm) followed by inverted T waves on I, aVL on ECG. On echocardiogram there was concentric LVH with impaired systolic function (LVEF 40-45%). Additionally, blood test showed significantly increased troponin I levels (max 14228pg/ml, normal values < 6.3pg/ml). The diagnostic work up, included an abdominal ultrasound which showed a mass on the right suprarenal gland measuring 5.8x2.5cm. Blood tests showed high metanephrine levels, while MIBG scintigraphy test set the diagnosis of non- metastatic pheochromocytoma. Medical treatment with phenoxybenzamine was initiated followed by gradual normalization of blood pressure levels. Based on the clinical presentation, the troponin levels and the echo and ECG finding, the diagnosis of adrenergic myocarditis was considered so the patient was referred for a cardiac MRI.
Diagnostic Techniques and Their Most Important Findings:
The cardiac MRI showed normal biventricular size and function with mild concentric LVH. There was increased signal intensity on STIR-T2 images and T2 mapping values, findings consistent with myocardial edema. LGE images showed subepicardial myocardial enhancement at the basal and mid anterolateral walls of the left ventricle. Native T1 values and well as ECV were also abnormal (Native T1 1085msec, normal range 986-1025msec, ECV 32%/ Hct 34.2%). These findings were consistent with acute myocarditis. The patient underwent surgical resection of the adrenal mass. The histological examination confirmed the diagnosis of secreting pheochromocytoma. Six months later, the patient underwent a follow up cardiac MRI scan showing normalization of the wall thickness as well as regression of myocardial edema and LGE. In our case, a follow-up scan proved to be helpful in confirming the reversible nature of the myocardial damage observed in the first scan.
Learning Points from this Case:
Pheochromocytoma is a catecholamine-secreting tumor that arises mainly (80% of the cases) from the adrenal medulla or from extra-adrenal abdominal paraganglion tissue [1].
The classic presentation with severe headache, palpitations, chest pain, sweating, tremor is the most common.
High catecholamine levels can cause direct myocardial damage with necrosis of the myocytes, monocytic infiltration, medial thickening of small and medium size coronary arteries and interstitial fibrosis. [2-3].
CMR is a non-invasive imaging technique that can diagnose acute and chronic myocarditis [4].
Figure 1. Cardiac MRI, cine images: (A) Basal short axis view in 2023, (B) Basal short axis view in 2024, (C)Four chamber view in 2023, (D) Four chamber view in 2024. 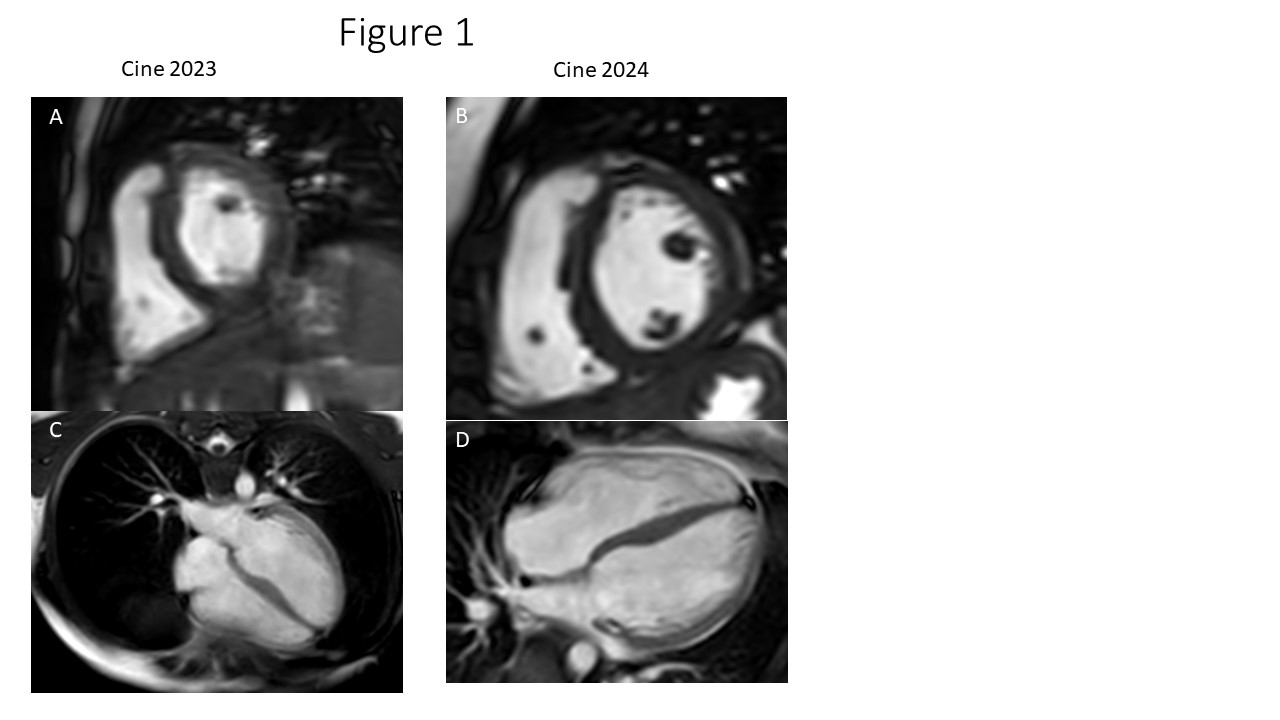
Figure 2. Cardiac MRI, STIR- T2 images. (A) Basal short axis view in 2023. White arrow shows increased signal intensity at the basal anterolateral wall. (B) Basal short axis view in 2024. White arrow shows the isointense area at the basal anterolateral wall. (C) Four chamber view in 2023. White arrow shows increased signal intensity at the basal anterolateral wall. (D) Four chamber view in 2024. White arrow shows the isointense area at the basal anterolateral wall. 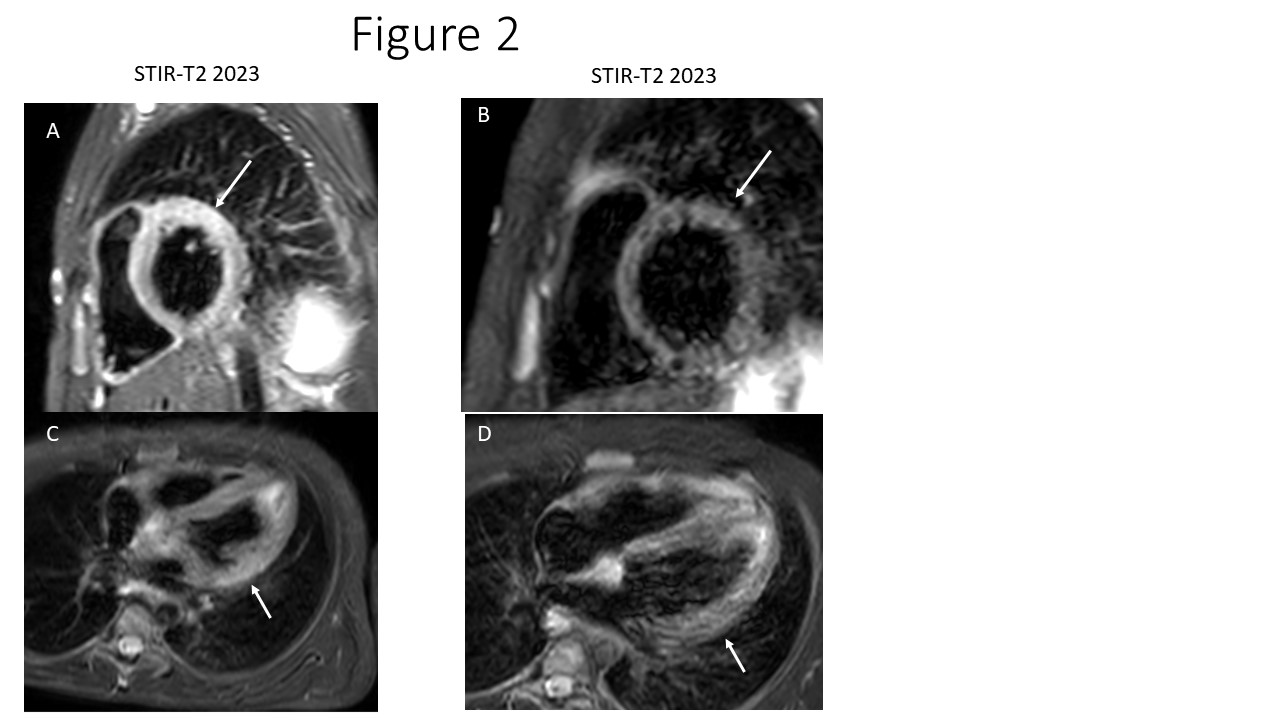
Figure 3. Cardiac MRI, PSIR LGE images. (A) Basal short axis view in 2023. White arrow shows myocardial enhancement at the basal anterolateral wall. (B) Basal short axis view in 2024. White arrow shows the same area at the basal anterolateral wall with no myocardial enhancement. (C) Four chamber view in 2023. White arrow shows with myocardial enhancement at the basal anterolateral wall. (D) Four chamber view in 2024. White arrow shows the same area at the basal anterolateral wall with no myocardial enhancement. .jpg)
