
Rapid Fire Abstracts
Debbie Falconer, MD
PhD research fellow
University College London, United Kingdom
Debbie Falconer, MD
PhD research fellow
University College London, United Kingdom
Giovanni Vagliani, MSc
Engineer
Epsidy, France
Maroua Mehri, PhD
Engineer
Epsidy, France
Mohammed Bhiri, BEng
Electronic engineer
Epsidy, France
Isabelle Whitmore, BSc
Medical student
University College London, United Kingdom
Matt Webber, MD, BSc
Research Fellow
University College London, United Kingdom
Jonathan Bennett, MBBS
Dr
University College London
Emma Martin
Miss
University College London, United Kingdom
Haytham Shah, BSc
Medical student
University College London, United Kingdom
Pier Lambiase, MD, PhD
Professor of Cardiology
University College London, United Kingdom
Nishi Chaturvedi, PhD
Professor
University College London, United Kingdom

James C. Moon, MD
Professor of Cardiology
University College London, United Kingdom

Thomas A. Treibel, MD, PhD
Associate Professor
University College London, United Kingdom
Iain Pierce, PhD
CMR Physiicist
University College London and Barts Heart Centre, United Kingdom
Alun D. Hughes, MD, PhD
Professor
University College London, United Kingdom
Peter Kellman, PhD
Director of the Medical Signal and Image Processing Program
National Heart, Lung, and Blood Institute, National Institutes of Health
Guillaume Calmon, PhD
Engineer
Epsidy, France

Gabriella Captur, MD, PhD
Senior Lecturer
UCL Institute of Cardiovascular Science, United Kingdom
.jpg)
Electrocardiographic (ECG) signals collected inside the magnetic resonance (MR) scanner bore are distorted by field gradient artefacts and the magnetohydrodynamic effect, meaning they are non-diagnostic except for R-peak detection. We implemented and validated a novel hardware/software system that collects diagnostic 12-lead ECGs inside the 3 Tesla(T) MR scanner bore and is capable of measuring ischaemic changes during adenosine infusion.
Methods:
Standard 12-lead ECGs were recorded on participants of the MyoFit46 sub-study of the National Survey of Health and Development outside the MR environment. 3T cardiac MR (CMR) scans were then performed with in-bore 12-lead ECGs collected using MR-safe electrodes (each with 3 measurement and 1 reference electrodes, Fig1a). Short leads connected each electrode to a sensor for signal amplification and digitalisation (Fig1b). Signals were transmitted via fibre-optic cables running through a penetration hole to reach an electronics signal module and laptop (32 cores,5.2 GHz) equipped with Epsidy software (Fig1c). ECGs were acquired and averaged over 10 cardiac cycles at rest (prior to starting adenosine) and at the end of the 4-minute (140mcg/kg/min) adenosine infusion, immediately prior to stress perfusion sequence acquisition. Artificial intelligence filtering removed gradient artefacts and a subject-specific matrix was applied to reconstruct 12-lead ECGs from the raw signal.
In-bore and reference out-of-bore ECGs were compared using Pearson's correlation coefficient on the PQRST waveform morphology for each lead, and by manually measuring QRS and cQT durations. Ischaemic changes during adenosine were defined as new T-wave inversion/flattening or ST depression/elevation in ≥1 leads per territory. Stress myocardial blood flow (sMBF) from quantitative perfusion maps was analysed as per the 17-segment American Heart Association model.
Results:
20 participants were recruited (60% male, 76±0years). In-bore 12-lead ECGs were successfully reconstructed at rest and during adenosine in all cases.
In-bore resting 12-lead ECGs correlated closely with out-of-bore ECGs, with a mean correlation coefficient of r=0.86 (95% confidence interval[CI]0.82–0.90) when comparing PQRST waveform morphology (Fig.2). Mean difference (MD) in QRS duration between the ECGs was 4ms (95% limit of agreement [LOA] -17, 25ms) and MD in cQT interval was 1ms(95% LOA -22, 21ms).
Sensitivity, specificity, positive predictive value (PPV) and negative predictive value (NPV) of in-bore ECG during adenosine for detecting corresponding segments with sMBF< 1.5ml/min/g were 67% (95%CI 41–86%), 83% (67–93%), 67% (41–86%) and 83% (67–93%) respectively, and for detecting sMBF< 1.2ml/min/g were 75% (22–97%), 70% (55–82%), 17% (4–42%)% and 97% (84–99%, Fig3).
Conclusion:
High-quality diagnostic 12-lead ECGs can be safely collected in the MR-bore at 3T at rest and during adenosine infusion. Resting in-bore ECGs correlate strongly with ECGs collected outside the MR environment. In-bore ECG signals have good specificity and NPV for detecting regional inducible ischaemia during quantitative stress perfusion.
This novel technology could facilitate seamless integration of in-bore 12-lead ECG data with quantitative stress perfusion maps to improve their interpretability in clinical practice.
Figure 1. Equipment set up for in-CMR-bore 12-lead ECG recordings.1a: Example electrode patch with 3 separate measurement electrodes and 1 reference (black) electrode. 1b: Configuration of each electrode on a participant’s chest. Each electrode is connected to a sensor (grey box) via a short lead (black line) for signal amplification and digitalization. Short leads prevent overheating from the radiofrequency gradient minimizing the risk of burns. 1c: Hardware set-up inside and out of the MR environment. Cables are bound together and pass through a penetration hole connecting the scanner room with the reporting room.
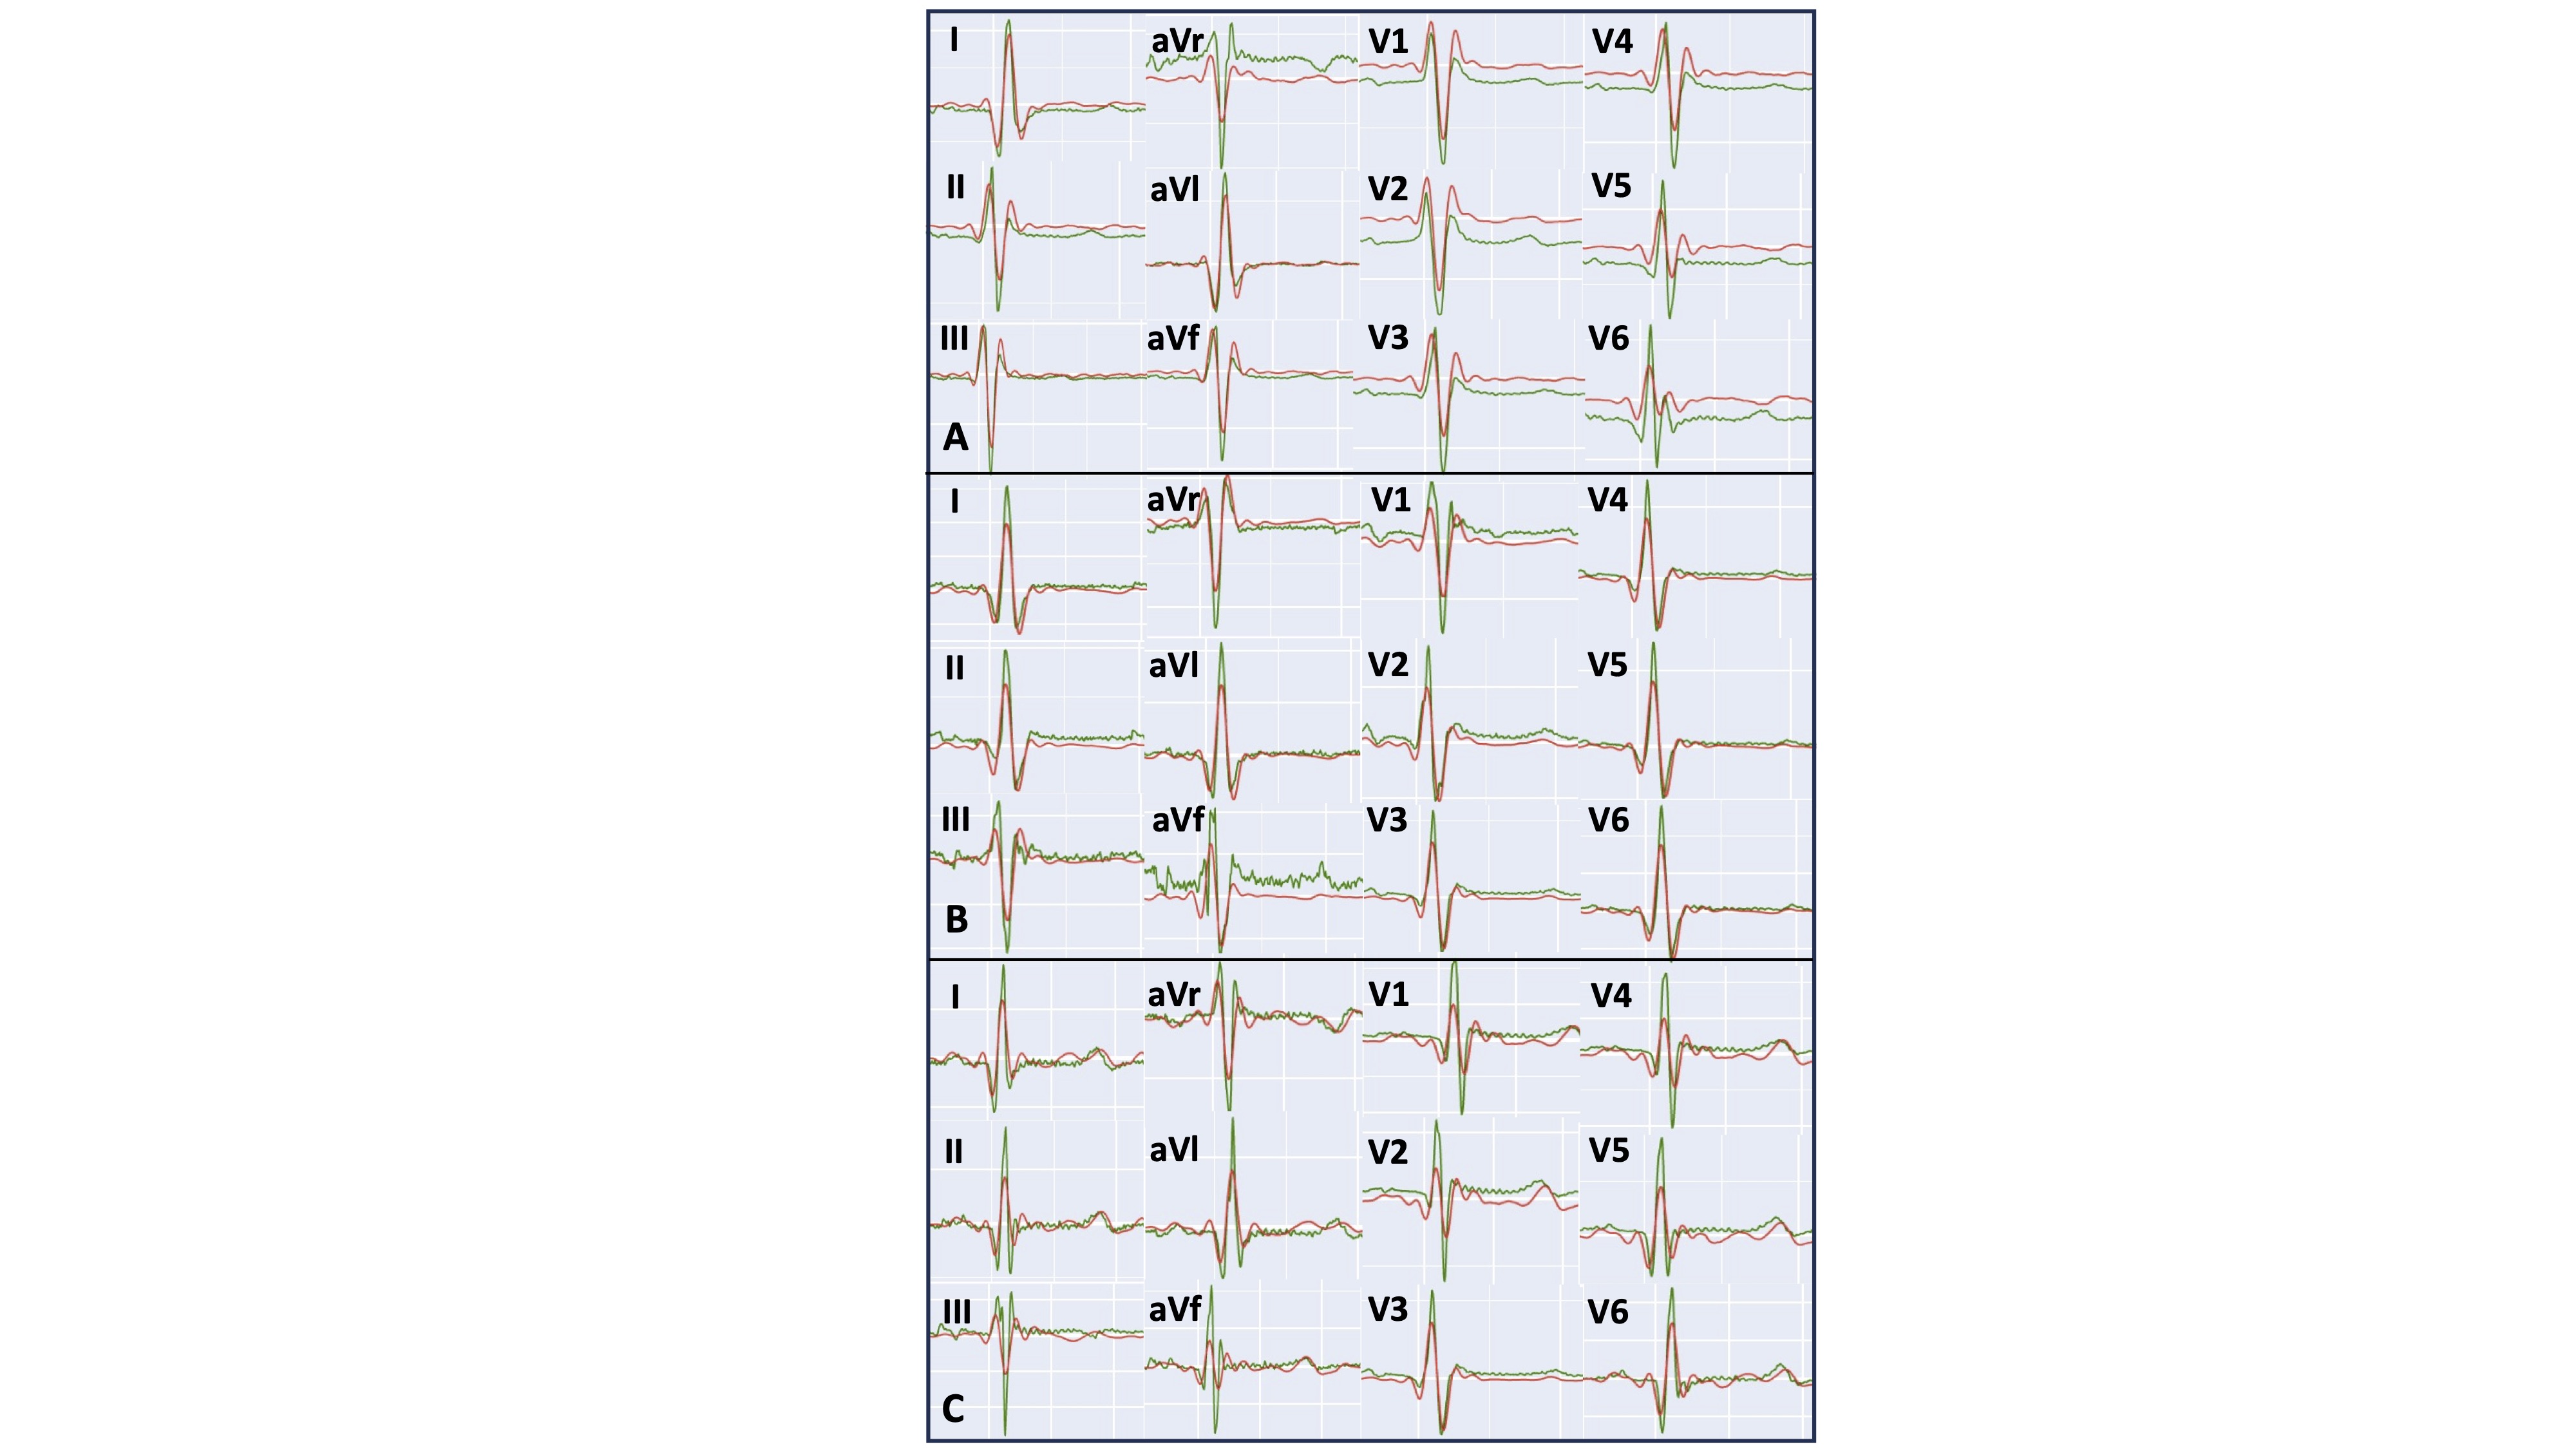
Figure 2. Examples from 3 participants each showing reference 12-lead ECG from outside the CMR environment (green line) and superimposed reconstructed 12-lead ECG from inside the CMR bore (red line). A: mean correlation across all leads: 0.90; B mean correlation 0.76; C: mean correlation 0.9.
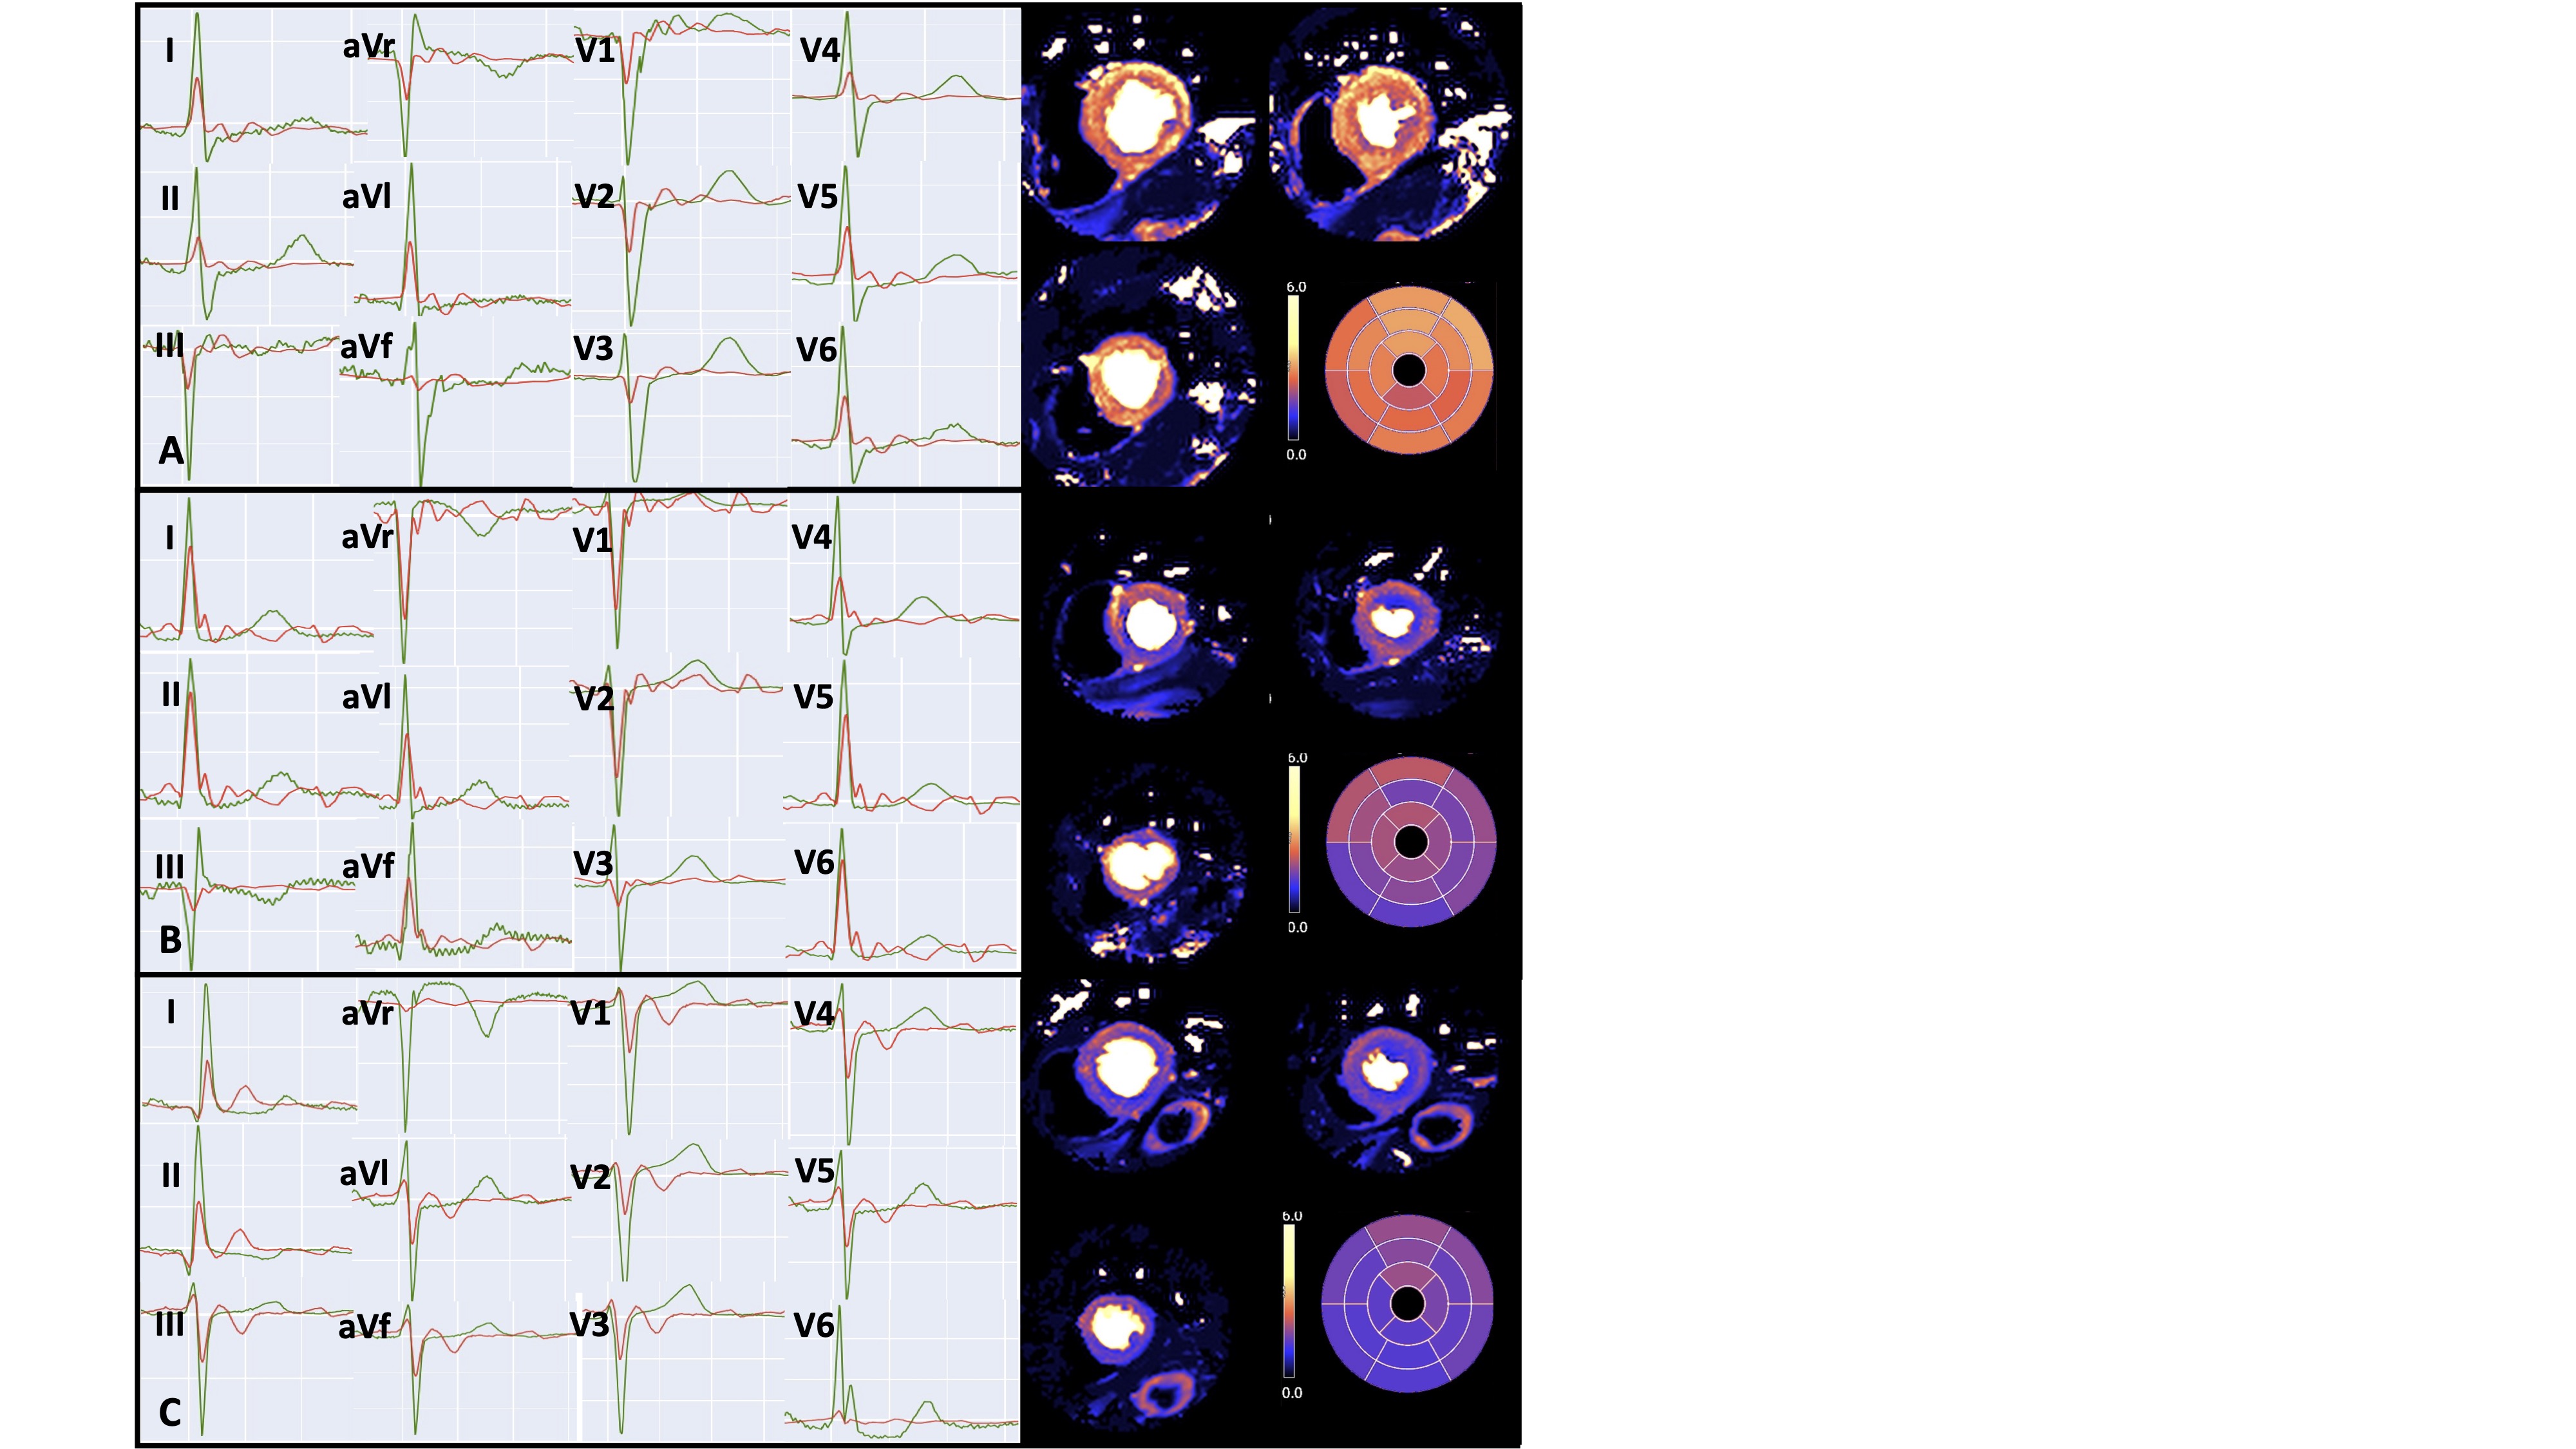
Figure 3: Examples of ECGs from 3 participants showing corresponding quantitative basal, mid and apical stress perfusion maps. Green signal represents reference ECG recorded outside the MR environment using conventional 12-lead electrode placement. Red signal represents reconstructed ECG recorded at peak adenosine infusion in the MR scanner bore. A: participant with normal stress MBF and no ischaemic ECG changes; B: participant with inducible infero-lateral TWI on ECG during peak adenosine and matching regional MBF reduction; C: participant with inducible global TWI during peak adenosine infusion and matching globally reduced MBF. ECG: electrocardiogram; MBF: myocardial blood flow; MR: magnetic resonance, TWI: T wave inversion
