ISMRM - SCMR Workshop
May T. Lwin, MB
Clinical Research Fellow
University of Leeds, United Kingdom
May T. Lwin, MB
Clinical Research Fellow
University of Leeds, United Kingdom
Sam Coveney, PhD
Research Fellow
University of Leeds, United Kingdom
Richard J. Foster, PhD
Research Fellow
University of Leeds, United Kingdom
Maryam Afzali, PhD
Research Fellow
University of Leeds, United Kingdom
Raluca Tomoaia, MD, PhD
Research Fellow
University of Leeds, United Kingdom
Lars Müller, PhD
Research Fellow
University of Leeds, United Kingdom
Nadira Yuldasheva, PhD
Professor
University of Leeds, United Kingdom

Sven Plein, MD, PhD
Professor of Cardiology
Leeds Institute of Cardiovascular and Metabolic Medicine, United Kingdom
Filip Szczepankiewicz, PhD
Associate Senior Lecturer
Lund University, Sweden

Jurgen E. Schneider, PhD
Chair in Biomedical Imaging
University of Leeds
University of Leeds, United Kingdom
Erica Dall'Armellina, PhD
Associate Professor and Honorary Consultant Cardiologist
University of Leeds, United Kingdom

Irvin Teh, PhD
Senior Research Fellow
University of Leeds, United Kingdom
Cardiac q-space trajectory imaging (QTI) is a cutting-edge technique that could provide additional specificity in microstructural measurements relative to diffusion tensor imaging (DTI), as recently demonstrated in healthy volunteers1. For the first time, we performed in vivo cardiac QTI in a pilot cohort of patients with hypertrophic cardiomyopathy (HCM) to evaluate its clinical potential.
Methods:
Healthy volunteers (HV; N = 10) and patients with HCM (HCM; N = 10) were scanned on a Prisma 3T MRI scanner (Siemens Healthineers, Erlangen, Germany). The latter were recruited from the local inherited cardiac conditions clinic and met guideline criteria for HCM with wall thickness ≥ 15 mm in one or more segments. The study was performed under approved ethics and informed consent was received. Tensor-valued diffusion encoding was performed using a custom spin-echo sequence with echo planar imaging (EPI) with reduced field-of-view2. 2nd order motion-compensated planar and linear b-tensor encoding (PTE and LTE) waveforms were numerically optimised to achieve minimal echo time3. Subjects were scanned free-breathing with cardiac-triggering: TR = 5 RR‐intervals; TE = 118 ms; resolution = 3.5 × 3.5 × 10 mm3; slices = 5; FOV = 320 × 111 mm2; b = [0.1, 0.4, 0.7, 1.0, 1.3] ms/μm2 for [10, 20, 30, 40, 50] directions, respectively. Data were processed with an in-house toolbox4, and registered in 2D in SimpleElastix in a slice-wise manner. QTI signal representations1 were fitted to the data to estimate mean diffusivity (MD), fractional anisotropy (FA), microscopic FA (μFA), anisotropic, isotropic, and total mean kurtosis (MKa, MKi, MKt), using the multi-dimensional diffusion MRI framework5.
Results:
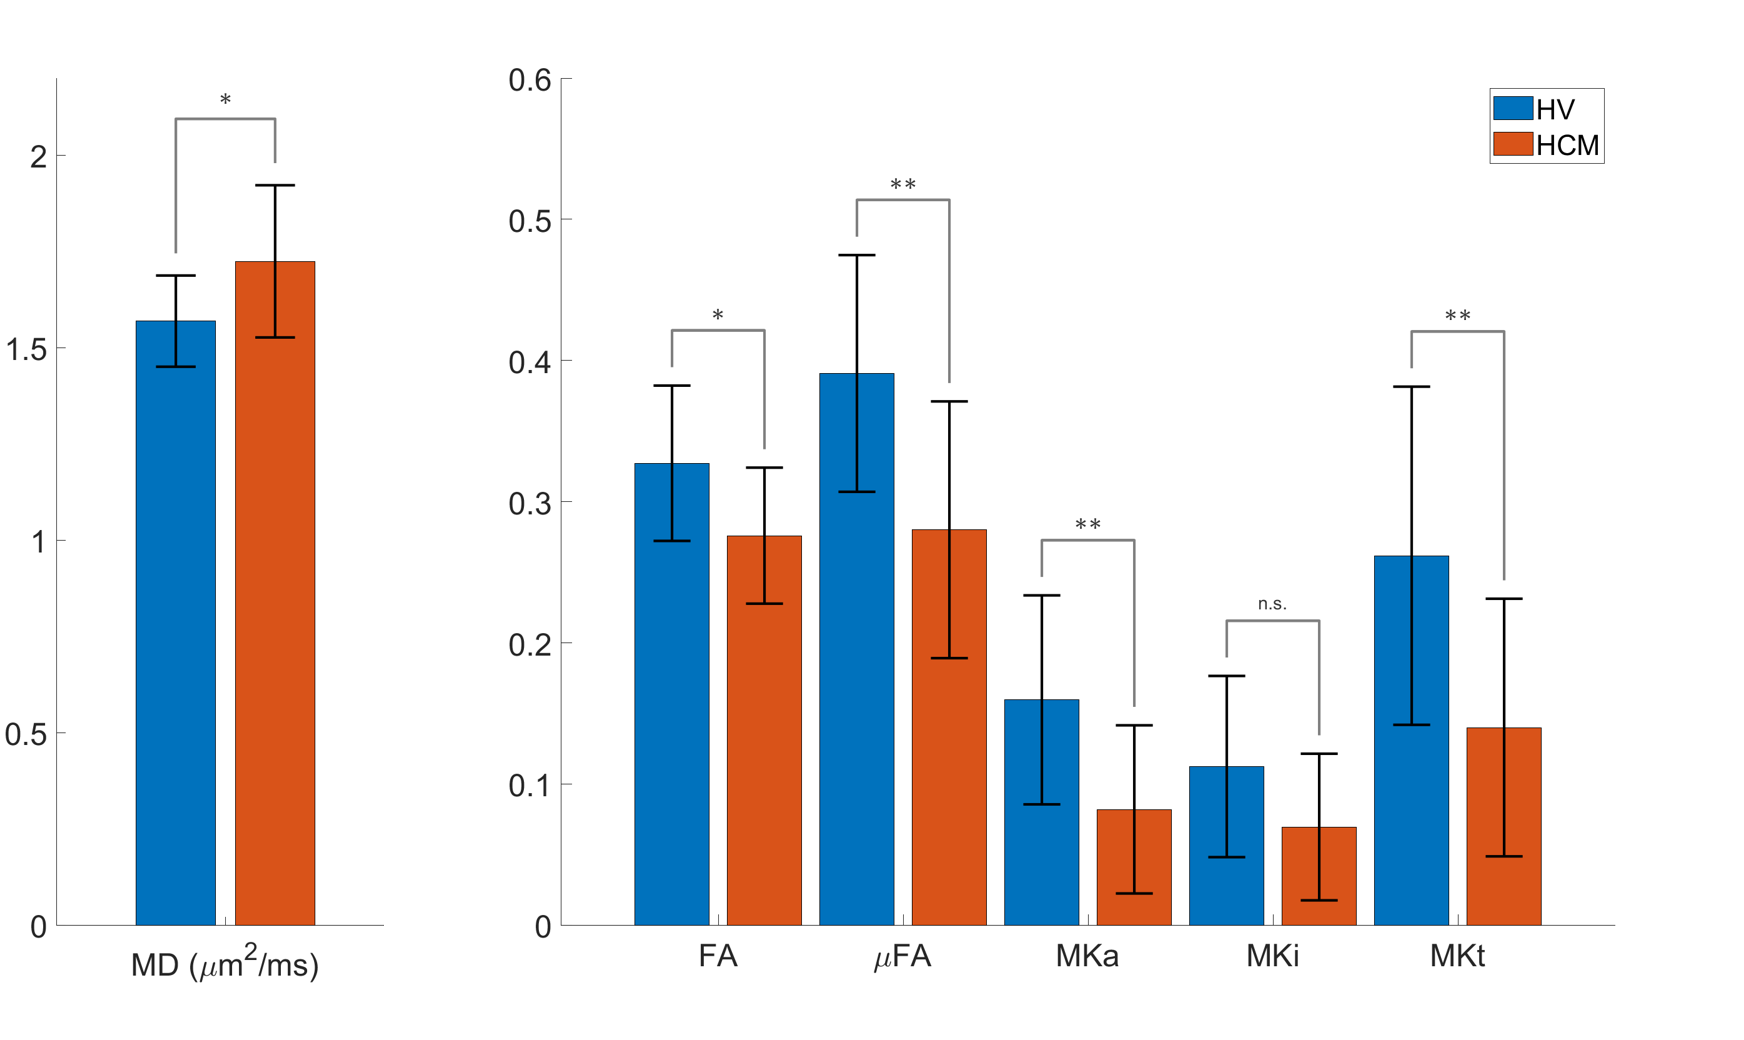
The left ventricular myocardial mass in the HV and HCM groups was 89 ± 23 g and 111 ± 19 g, respectively. The signal attenuation with increasing b-value was seen to be non-monoexponential. A higher signal attenuation was observed in the PTE relative to LTE data, which was more pronounced at higher b-values (Fig 1). QTI maps are illustrated in Fig 2. Group differences were observed between HV and HCM (Fig 3). Relative to HV, the HCM group had higher MD (1.72 ± 0.20 vs 1.57 ± 0.12 μm2/ms), and lower FA (0.28 ± 0.05 vs 0.33 ± 0.06), μFA (0.28 ± 0.09 vs 0.39 ± 0.08), MKa (0.08 ± 0.06 vs 0.16 ± 0.07) and MKt (0.14 ± 0.09 vs 0.26 ± 0.12).
Conclusion:
We present the first clinical application of QTI in patients with cardiovascular disease. Our findings reveal significant differences in MD, FA, μFA, MKa, and MKt between healthy volunteers and patients with HCM, which is likely in keeping with increased interstitial fibrosis in the latter. Whilst MD and FA can also be measured using DTI, QTI provides additional complementary parameters μFA, MKa, and MKt. Using QTI, we are able to quantify non-Gaussian diffusion arising from the restrictions in the underlying microstructure e.g. cell membranes. This could provide more specific information relating to the cell organisation, and potentially enable distinguishing between changes in cell size and cell disarray, both hallmarks of HCM. Larger cohort sizes will be needed to validate QTI clinically.
Figure 1. (Left) Representative mid-myocardial short-axis slice in one healthy volunteer, showing segmentation of the left ventricular septal wall; (right) corresponding normalised signal attenuation curves showing increasing divergence between linear (green) and planar (orange) tensor encoding at higher b-values.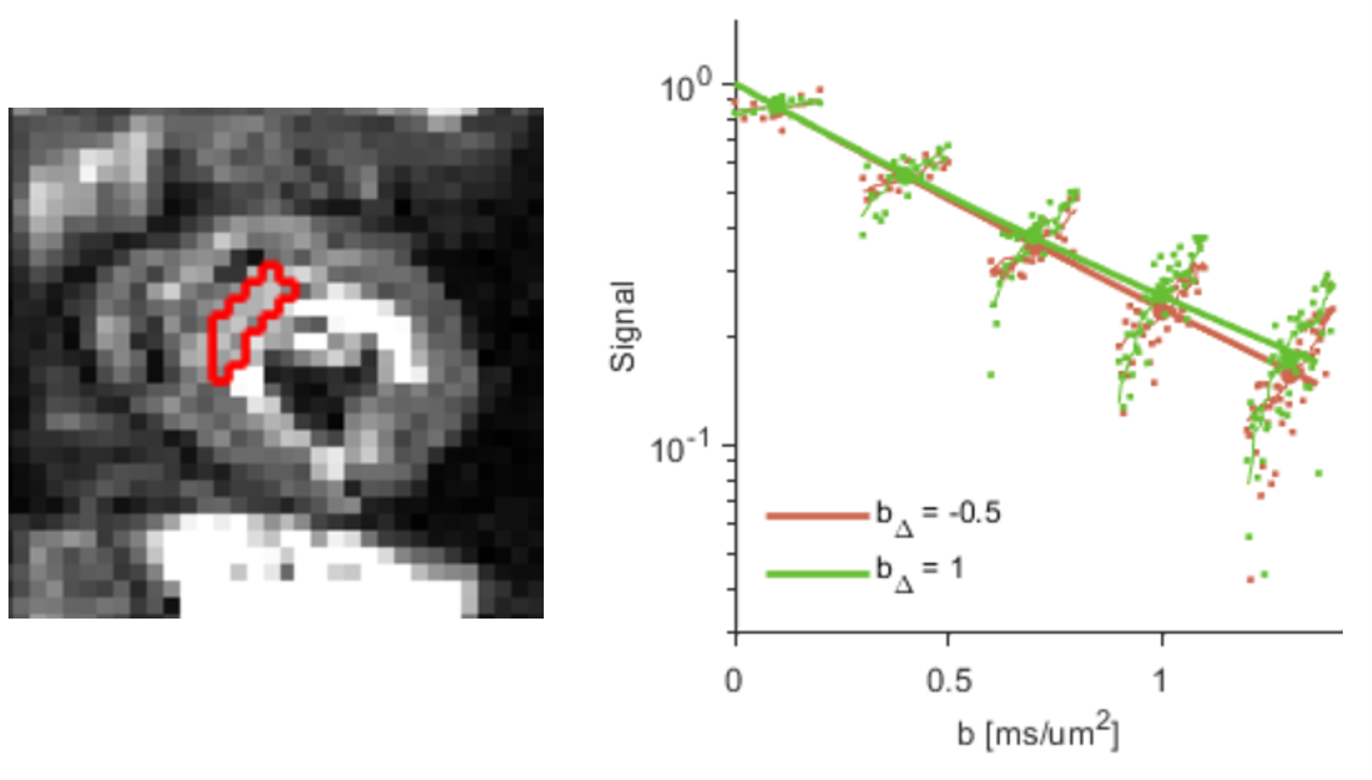
Figure 2. Example QTI parameter maps in a healthy volunteer (HV) and patient with HCM. Maps include (left to right): mean diffusivity (MD; μm2/ms), fractional anisotropy (FA), microscopic FA (μFA), anisotropic, isotropic and total mean kurtosis (MKa, MKi, MKt) maps alongside extrapolated non-diffusion-weighted image (S0).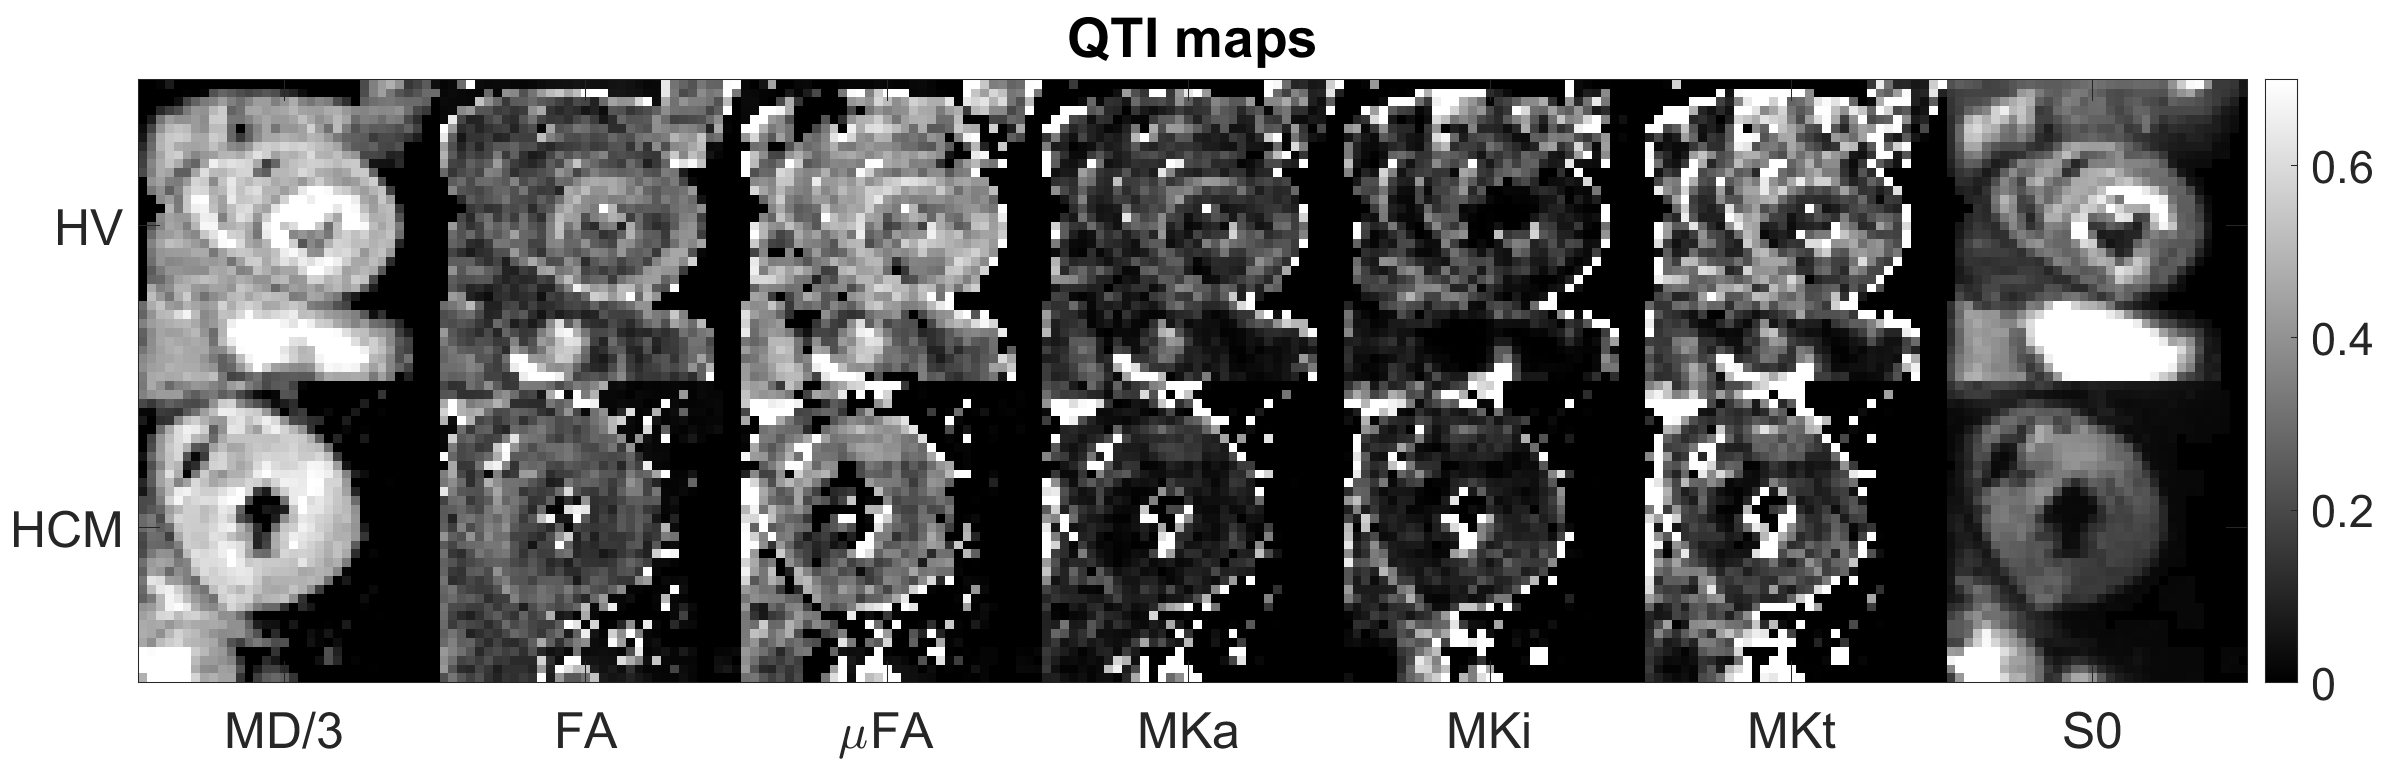
Figure 3. Group-wise comparisons of QTI parameter maps between healthy volunteers and patients with HCM. Values from left ventricular septal wall of mid-myocardial short-axis slice. Two sample t-tests were performed, and significant differences denoted by p < 0.05 (*) and p < 0.01 (**).